Sustained, complete response to pexidartinib in a patient with CSF1R-mutated Erdheim–Chester disease
Funding information: Predolin Foundation Biobank; University of Iowa/Mayo Clinic Lymphoma SPORE, Grant/Award Number: CA97274
Abstract
Erdheim–Chester disease (ECD) is a histiocytic neoplasm that predominantly harbors mitogen-activated protein kinase (MAPK) pathway variants. MAPK inhibitors typically are effective treatments, but mutations outside the MAPK pathway, such as CSF1R variants, may cause refractory ECD. We describe a patient with a novel somatic mutation in CSF1R (CSF1RR549_E554delinsQ) that resulted in refractory ECD affecting the central nervous system. Cell model studies, RNA sequencing analysis, and in silico protein modeling suggested that she had a gain-of-function mutation occurring in a region critical for autoinhibition. The patient was treated with pexidartinib, a CSF1R inhibitor, and has had a complete clinical and metabolic response lasting more than 1.5 years to date. To our knowledge, this is the first report to describe successful treatment of a patient with ECD by using an agent that specifically targets CSF1R. This case also highlights the critical role of individualized molecular profiling to identify novel therapeutic targets in ECD.
1 INTRODUCTION
Erdheim–Chester disease (ECD) is a rare neoplasm that presents as xanthogranulomatous tissue infiltration of organs by non-Langerhans histiocytes (CD68+/CD163+/factor-XIIIa+/CD1a−).1, 2 Most ECD tumors have constitutive activation of the extracellular signal−regulated kinase (ERK) axis. Approximately 80% of cases have clonal alterations in genes encoding components of the mitogen-activated protein kinase (MAPK) signaling pathway (most are BRAFV600E), and 10% have variants in the phosphatidylinositol 3-kinase−protein kinase B (PI3K-AKT) signaling pathway.2-4 Recently, point mutations in CSF1R, encoding the macrophage colony-stimulating factor 1 receptor, were identified in several patients with histiocytic neoplasms,5 but the therapeutic benefit of CSF1R inhibition in this setting is unknown. Here, we report the efficacy of the CSF1R inhibitor pexidartinib in a patient with refractory ECD who had a novel, somatic, activating, in-frame deletion in the CSF1R gene (CSF1RR549_E554delinsQ).
2 METHODS
All studies were performed by the Mayo Clinic Hematology Research Laboratory (Rochester, MN), in accordance with the principles described in the Declaration of Helsinki and after receiving approval from the Mayo Clinic Institutional Review Board. The patient's clinical records were reviewed to confirm that treatment with pexidartinib commenced after obtaining written informed consent from the patient and approval from the patient's insurance provider.
2.1 DNA and RNA sequencing
Targeted NGS covering 648 genes (please refer to Supplementary Material for further details of 648-gene panel) and whole-transcriptome RNA sequencing of the tumor were obtained by using the xT assay (Tempus; Chicago, IL). A proprietary variant-prioritization algorithm (Tempus) was used to rank likely or confirmed disease-associated variants with possible clinical impact.6 Sequencing data were reprocessed with the GTEx RNA-Seq pipeline,7 and the microglial cell-of-origin for the tumor was confirmed with canonical microglial genes from the literature (please see the supplementary file Microglial-Genes.xlsx).8, 9 Wild-type human microglial gene expression data were obtained from a previous study10 and reprocessed with the same bioinformatics pipeline. Differential gene expression between the case versus the controls (i.e., wild-type microglia) was assessed by normalizing the gene read counts to library depth, log-transforming the read counts, computing the per-gene z score for expression in the case versus the control, transforming the z score into a p-value, and using the Benjamini-Hochberg method to correct the differential expression p-value. Gene set enrichment analysis was performed with GSEA software (version 4.0.0) using a pre-ranked method,11 and pathway-enrichment false-discovery rates were computed with the default permutation method.
2.2 Functional validation of the CSF1RR549_E554delinsQ variant
To obtain DNA from primary tissue, formalin-fixed paraffin-embedded tissue slides underwent deparaffinization with xylene and ethanol and subsequently were rehydrated with 3% glycerol. The tissue was carefully removed from the slide with a sterile razor, and DNA was extracted using the direct protocol from the AllPrep DNA/RNA FFPE kit (cat# 80234; Qiagen; Germantown, MD). Samples of peripheral blood, collected in ethylenediaminetetraacetic acid, were subject to density-gradient centrifugation to obtain the enriched fraction of mononuclear cells; DNA was isolated from this fraction with the Qiagen QIAamp DNA Blood Mini kit (cat# 51104). DNA samples (40 ηg) from primary tissue and blood were submitted for variant analysis.
To amplify the region containing the CSF1R variant, we used the following oligonucleotide primers: CSF1R forward 5′-GGAGGGAAGGTCACACAACA-3′; and CSF1R reverse 5′-CATCTTCACAGCCACCTTCA-3′. The conditions for polymerase chain reaction (PCR) amplification were as follows: 1× of 10× PCR buffer (Roche Applied Science; Indianapolis, IN), 0.5 units of Taq polymerase (Roche Applied Science), 400 ηM each of CSF1R forward and CSF1R reverse oligonucleotide primers, 300 μM of each dNTP, 40 ηg of DNA template, and sterile water to a final reaction volume of 50 μl. Cycling parameters were as follows: initial denaturation at 94°C for 2 min; 40 cycles of amplification (denaturation at 94°C for 15 s, annealing at 56°C for 30 s, and extension at 72°C for 45 s); and final extension at 72°C for 1 min. PCR products were purified with the QIAquick PCR purification kit (Qiagen; Valencia, CA) and subjected to bidirectional sequencing. Sequencing traces were read with Sequencher software (Gene Codes Corp; Ann Arbor, MI). For better separation of the mutated versus wild-type CSF1R allelic sequences, PCR products were subcloned with the TOPO TA cloning kit (cat# K460001SC; ThermoFisher; Waltham, MA), following manufacturer instructions. Transformed Escherichia coli were plated on prewarmed Luria broth (LB) plates containing 75 μg/mL ampicillin. Within 36 h, 10 white colonies were selected from blue–white x-gal screening and cultured overnight in LB medium containing 75 μg/mL ampicillin. DNA was extracted with the plasmid DNA Maxiprep kit (Qiagen). Isolated clonal DNAs were sequenced as described above, with the forward primer.
2.3 In silico modeling of the protein structure
The protein crystal structure with pexidartinib bound (Protein Data Bank: 4r7h) consists of amino acids (aa) 544–915 with missing regions aa 555–561 and aa 687–747. The N-terminus region (aa 451–543) was modeled by submitting the sequence to the I-Tasser server (https://zhanglab.ccmb.med.umich.edu/I-TASSER/) and aligning it with the aa 544–915 model. The variant structures were built with Coot software (https://www2.mrc-lmb.cam.ac.uk/personal/pemsley/coot/), and bonds were regularized after applying torsion, planar peptide, transpeptide, and Ramachandran restraints. Protein structures were visualized with Chimera 1.14 (https://www.cgl.ucsf.edu/chimera/download.html). The variant model structure was simulated with AutoDock Vina 1.1.2 (Scripps Research).
2.4 Assessment of protein expression on tumor tissue through immunohistochemistry
The clones used to test each immunohistochemical (IHC) marker are listed in Table S1. Testing was performed on formalin-fixed paraffin-embedded tissue sections. We used Benchmark XT automated stainers (Ventana Medical Systems; Tucson, AZ) and followed standard methods.
2.5 Expression of wild-type and variant CSF1R in cell models
We purchased a retroviral construct (cat# 115523; Addgene) expressing wild-type human CSF1R and co-expressing green fluorescent protein (GFP) driven by an internal ribosome entry site (IRES) sequence (originally described by Roussel et al.12). The patient-specific construct with the deletion variant (CSF1R-mut, del1646GCTGGAAGATCATCG1660) was made by using the QuikChange II site-directed mutagenesis kit (cat# 200523; Agilent) with the forward mutagenic primer (5′-CCCAAGTACCAGGTCCAGAGCTATGAGGGCAA-3′) and reverse mutagenic primer (5′-TTGCCCTCATAGCTCTGGACCTGGTACTTGGG-3′). Wild-type and variant DNA constructs were used to make retroviral particles with the Phoenix Ampho 293 cell line and lipofectamine 2000 (cat# 1168019; Invitrogen), following manufacturer instructions. HEK293, HeLa, and OCI-Ly19 cell lines were infected with retrovirus; 48 h later, GFP-positive cells were collected and used for immunoblotting studies of the MAPK and PI3K-AKT pathways. OCI-Ly19 cells had the lowest background AKT and ERK activation and thus were used in the experimental assays. Cell lines were purchased from ATCC (Manassas, VA) or DSMZ (Braunschweig, Germany) and were cultured according to instructions listed by the respective tissue repositories. All experiments were conducted using cells, which have undergone less than 20 passages after thawing and were authenticated through short tandem repeat testing. Cell lines were also routinely assessed for mycoplasma contamination.
2.6 Cells sorting and flow cytometry
OCI-Ly19 cells were transduced with CSF1R-wt-IRES-GFP or CSF1R-mut-IRES-GFP constructs retrovirally and 48 h later, GFP expressing cells were flow-sorted and collected. Post-sort cells were further expanded in culture, and their expression of CSF1R-wt and CSF1R-mut proteins were then assessed by GFP level using flow cytometry (Accuri C6; BD Biosciences; San Jose, CA) through FlowJo (version 10; Tree Star) software.
2.7 Immunoblotting
OCI-LY19 cells were lysed in radioimmunoprecipitation assay buffer containing protease inhibitor, phenylmethylsulfonyl fluoride, and phosphatase inhibitor (Halt™; Thermo Fisher Scientific) to obtain total cellular proteins. Cell lysates were resolved electrophoretically with precast 4%–15% gradient Criterion TGX Midi protein gels (Bio-Rad), transferred to polyvinylidene fluoride membranes, and blocked with EveryBlot blocking buffer (cat# 12010020; Bio-Rad). Cell lysates were probed with antibodies against p-AKT (cat# 2965S), total AKT (cat# 2967S), p-ERK 1/2 (cat# 9106S), total ERK (cat# 4695S), and CSF1R (cat# 3152S), all from cell signaling; and β-actin antibody (cat# sc4778) from Santa Cruz Biotechnology. Images were developed either with a Li-COR imager or with radiography film (SuperSignal West Pico PLUS kit, cat# 34580; Thermo).
2.8 Radiographic response assessment
The radiographic response was assessed in accordance with the Lugano classification system.13 Visage Enterprise Imaging software (Pro Medicus Limited; Richmond, Australia) was used for image review. The examinations were reviewed by a board-certified nuclear radiologist with expertise in histiocytic neoplasms (Jason R. Young). The imaging equipment and techniques used were in accordance with standard procedures for clinical oncologic imaging. Magnetic resonance imaging (MRI) was performed with a 1.5 to 3.0 Tesla magnetic field strength, and weight-based gadobutrol (0.1 ml/kg body weight) was used as the MRI contrast agent. Sequence and imaging parameters of the MRI were as follows; axial, coronal, and sagittal T1 3D with gadolinium: TR = 7.204 ms/TE = 3.06 ms/TI = 450 ms/slice thickness = 1 mm/field of view = 256 mm/slice spacing = 1 mm/matrix = 256 x 256. F-18 fluorodeoxyglucose (FDG) positron emission tomography−computed tomography (PET-CT) examinations used three-dimensional lutetium yttrium orthosilicate detectors (128 × 128 matrix, 70-cm field of view) with a 3- to 5-min acquisition time per PET-CT bed position. Low-dose, nonenhanced CT was used for PET attenuation correction. Standard uptake values were calculated from body weight and volumes of interest, measuring the most metabolically active sites of disease. FDG-avid disease was defined as uptake that visually exceeded uptake in normal adjacent structures.
3 RESULTS
3.1 Patient presentation
A 21-year-old woman presented with headaches, impaired vision, and bilateral lower extremity weakness. She used a wheelchair for ambulation. Her physical examination showed severe paraparesis, with hyporeflexia of the lower extremities, and diplopia. MRI of the brain showed extensive enhancement associated with T2 hyperintensity along the optic chiasm and basal ganglia. MRI of the spine showed leptomeningeal enhancement with mass-like nodularity along the spinal cord and nerve roots. FDG F 18 PET-CT and a technetium Tc 99 m methylene diphosphonate bone scan did not show any organ involvement outside the central nervous system. A cauda equina nerve root biopsy showed atypical histiocytic infiltrates. IHC analysis showed that the biopsy sample was CD163+, factor XIIIa+, cyclin D1+, CD1a−, OCT2−, S100−, langerin−, and negative for BRAFV600E, which was consistent with a histiocytosis in the xanthogranuloma family. Commercial targeted next-generation sequencing (NGS) of the tumor with the Tempus Labs xT gene panel initially did not identify any disease-associated variants. Diagnosis of ECD was suspected at this point.
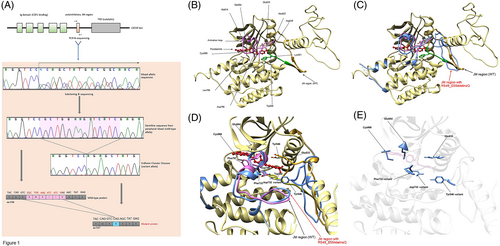
Patient was sequentially treated with cobimetinib (a mitogen-activated protein kinase [MEK] inhibitor), pegylated interferon-alfa, and high-dose methotrexate, however, despite these treatments patient had refractory disease with clinical and radiographic evidence of disease progression. A repeat PET-CT scan done 10 months after the initial diagnosis showed hypermetabolism throughout the spinal cord and nerve roots, along with new FDG-avid sclerotic lesions in the distal femur and proximal tibia bilaterally, thus confirming the diagnosis of ECD. She underwent a repeat biopsy of the cauda equina nerve root, and histopathologic results were similar to those of the prior biopsy (Figure S1). Again, no disease-associated variant was identified with targeted NGS on this specimen, but this time, a variant of unknown significance was identified—a novel, in-frame deletion CSF1RR549_E554delinsQ, with an allele fraction of 27.4% (Figure 1A). We re-reviewed the raw data from the targeted NGS of the initial biopsy sample and noted that the same alteration had been previously identified. However, the variant had not been included in the Tempus report because it had not met their assay's validated reporting threshold, owing to low tissue cellularity. Somatic status of the variant was confirmed when we determined that the germline sequence of peripheral blood, obtained after treatment, did not show the mutation (Figure 1A).
3.2 Validation and in silico analysis of the functional relevance of CSF1RR549_E554delinsQ
When the CSF1R protein is bound by its ligand, the intracellular juxtamembrane (JM) domain undergoes transphosphorylation and a conformational change that exposes the activation loop and tyrosine kinase domain, suggesting the potential for downstream signaling.14 The CSF1RR549_E554delinsQ alteration consists of a 15-nucleotide deletion (c.1646_1660del) that results in a 6 aa residue, in-frame deletion plus insertion of glutamine (p.R549_E554 > Q), precisely in the JM hinge region. The structural and functional analyses suggested that this variant disrupts several key bonds involving residues Arg549, Trp550, and Lys551, which are essential for maintaining the structurally closed, autoinhibited protein conformation (Figure 1B).14, 15 In addition, the in silico analysis suggested that the mutation likely caused a structural change in the intracellular JM domain of CSF1R, leading to a receptor kinase that was constitutively activated, independent of ligand binding (Figure 1C).16 Finally, additional alterations in this region such as CSF1RY546_K551del and CSF1RY561_I564del (which cause ligand-independent kinase activation of the CSF1R protein) have been described, and they mimic the structural consequence of the CSF1RR549_E554delinsQ alteration (Figure S2).5, 14, 16
Subsequently, we used protein modeling to determine whether the variant could be targeted by the CSF1R inhibitor pexidartinib. Structure rendering suggested that pexidartinib compensates for the impaired JM domain of the variant by using π–π stacking15 to form several interactions with aa Tyr546 and Trp550 (Figure 1D). However, these residue interactions are not essential because pexidartinib additionally interacts with three residues (Asp796 [variant Asp732], Cys666, and Glu664) that are downstream of the JM domain (Figure 1D,E), resulting in the restoration of structural integrity and support of inhibitory function. Further in silico analysis showed that the pexidartinib-binding location was not changed in the CSF1RR549_E554delinsQ variant, but several residue interactions with pexidartinib were changed. The Tyr546 interaction with Asp633 was altered by moving the loop and forming an interaction with Asp796 (variant Asp732). CSF1RR549_E554delinsQ caused the loss of the Trp550 residue, and a hydrophobic interaction with pexidartinib was formed with Phe733 (aa residue Phe797 in the wild-type structure) and Tyr546 of the variant structure.
3.3 Analyses of tumor cell-of-origin and affected cellular pathways
We analyzed the cellular transcriptome of the patient's tumor and particularly focused on expression of microglial genes due to the close association of microglial cells with the ECD cell-of-origin, known crucial role of CSF1R in microglial cell viability and absence of other somatic variants identified in the patient's tumor.17, 18 Hierarchical clustering with human microglial genes did not distinguish between the patient's tumor and controls (Figure 2A). This finding confirmed that the tumor originated from microglial cells, which was consistent with the postulated cell-of-origin for ECD involving the central nervous system.18 In addition, the tumor cells showed unique upregulation of PI3K-AKT, NF-κB, and cell cycle pathway genes compared with expression levels in wild-type microglial cells.8, 9 In the tumor cells, the relative activation of the MAPK pathway was lower than that of the PI3K-AKT pathway (Figure 2B,D). These findings further support the predicted gain-of-function for CSF1RR549_E554delinsQ and downstream activation of key pathways involved in cellular proliferation.19
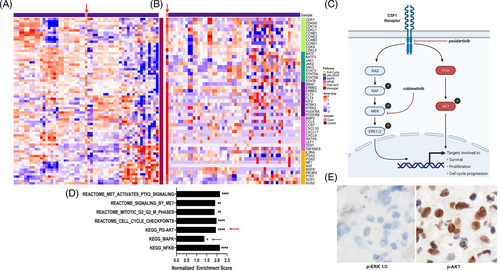
Activation of CSF1R induces signal transduction through two parallel pathways, MAPK and PI3K-AKT (Figure 2C),19 although stimulated CSF1R may cause more activation of the PI3K-AKT pathway.20 We assessed activation of both pathways by evaluating the expression of phosphorylated ERK (p-ERK) and phosphorylated AKT (p-AKT) proteins by IHC. In the tumor tissue, p-AKT expression was markedly higher than that of p-ERK (Figure 2E), which corroborated the findings of RNA sequencing and the in silico analysis by confirming the preferential activation of the PI3K-AKT pathway over the MAPK pathway. Moreover, the relative inactivity of the MAPK pathway could also explain the patient's lack of response to the MEK inhibitor cobimetinib (Figure 2C).
3.4 Functional validation of the effect of the CSF1RR549_E554delinsQ variant on the MAPK and PI3K-AKT pathways in a cell model system
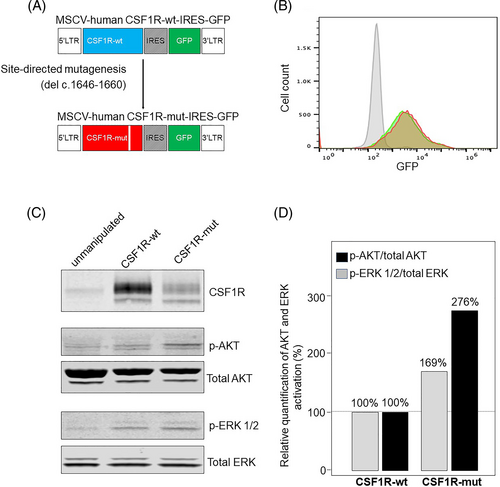
The CSF1RR549_E554delinsQ variant was cloned and expressed in human OCI-Ly19 cells (Figure 3A,B). We used OCI-Ly19 cells in our experiments because they showed low background levels of AKT and ERK activation (Figure 3C). To dissect the effect of the CSF1RR549_E554delinsQ variant on MAPK and PI3-AKT pathway induction, we used immunoblotting to detect p-ERK and p-AKT. Cells were not stimulated with the cognate ligands of CSF1R; CSF1, or IL34. The immunoblots showed that forced expression of the CSF1RR549_E554delinsQ variant showed greater activation of the PI3K-AKT pathway (Figure 3C,D) compared with cells expressing CSF1Rwild-type or control cells, thus confirming the in silico prediction that the CSF1RR549_E554delinsQ variant, located in the intracellular region, could trigger constitutive activation of the receptor kinase. Moreover, these results also validated the RNA sequencing studies that predicted that the CSF1RR549_E554delinsQ variant would cause a relative increase in PI3-AKT pathway activation compared to the MAPK pathway (Figure 2D). Importantly, the immunoblot results mirrored the p-ERK and p-AKT expression pattern seen with IHC staining of the patient's primary tissue (Figure 2E), and it further explained the patient's lack of meaningful clinical response to cobimetinib (the MEK inhibitor).
3.5 Targeting CSF1RR549_E554delinsQ with pexidartinib
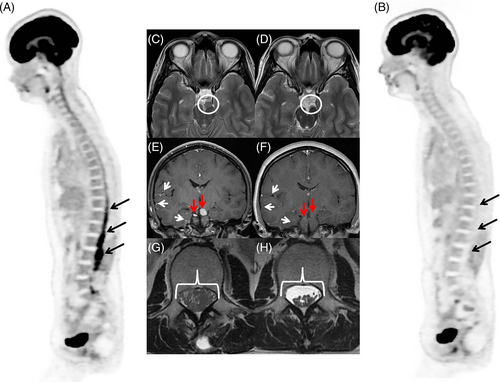
The patient began receiving pexidartinib (400 mg, orally, twice a day). Within 1 month of starting treatment, she noticed improvement of her hyporeflexia and paraparesis. She was able to ambulate with limited assistance. Her vision improved and her diplopia resolved. An MRI of the brain and spine and PET-CT, obtained 2 months and 3 months after pexidartinib initiation, respectively, showed a complete metabolic response, with resolution of the leptomeningeal and cranial nerve enhancement (Figure 4). Three months after starting pexidartinib, her clinical signs and symptoms resolved completely, and she was able to ambulate with a normal gait and without assistance. Her visual defects resolved, and her hyporeflexia diminished. At the time of manuscript writing, the patient continues to take pexidartinib and has maintained a complete response (no disease relapse) for more than 1.5 years.
4 DISCUSSION
Histiocytes are part of the mononuclear phagocyte system that has roles in immunity, tissue repair, inflammatory diseases, and cancer.1, 2, 21 The CSF1-CSF1R signaling pathway is an essential regulator of macrophage homeostasis.19 Although point mutations in CSF1R have been previously identified in patients with histiocytic neoplasms, such variants are rare, and to our knowledge, the CSF1RR549_E554delinsQ in-frame deletion has not been described previously in ECD or any other cancers to date.5, 22, 23 Furthermore, no published reports have described therapeutically targeting CSF1R alterations in patients with ECD or other hematologic neoplasms. In this report, we described the remarkable response achieved by targeting CSF1RR549_E554delinsQ with pexidartinib.
Pexidartinib is currently approved by the United States Food and Drug Administration solely for the treatment of tenosynovial giant cell tumor (TCGT), a destructive synovial tumor that overexpresses CSF1.24, 25 TCGT cells thus attract histiocytoid cells carrying wild-type CSF1R. CSF1R also was recently shown to be required for differentiation and migration of Langerhans cells in Langerhans cell histiocytosis (LCH).26 Histiocytic neoplasms and TGCT both are associated with inflammation; LCH has a proinflammatory tumor microenvironment that is rich in histiocytoid cells,2 and TGCT symptoms are caused by synovial inflammation.24, 25 Taken together, the important role of CSF1R in the pathophysiology of LCH and TCGT, plus the activity of pexidartinib in TCGT (response rate, 39%),24 may suggest that the inflammatory response orchestrated by histiocytoid cells with wild-type CSF1R potentially could be diminished by inhibiting CSF1R.
CSF1R expression levels in ECD tumor histiocytes should be further investigated because no other data about CSF1R expression levels in ECD have been published to date. If the CSF1R protein is overexpressed in most patients with ECD, pexidartinib potentially has a role in treating those with wild-type CSF1R. Currently, no preclinical models of histiocytic neoplasms are available that could be used to validate these hypotheses. Therefore, prospective studies are necessary to further define the role of CSF1R inhibitors in patients without a CSF1R variant.
The management of ECD has changed in the past decade, with the latest guidelines recommending a precision medicine-based approach that uses broad NGS oncogene panels to detect MAPK pathway variants.1 Vemurafenib was recently approved for treating patients with ECD carrying the BRAFV600E variant.27 For patients with other MAPK pathway variants, cobimetinib has shown activity in a phase 2 trial; however, none of the patients had variants in CSF1R or in other genes outside the MAPK pathway.3 Therefore, the current case serves as an important reminder that cobimetinib may not be effective for patients with wild-type BRAF histiocytosis who lack detectable variants in the MAPK pathway.
Our study has limitations. Despite conducting extensive studies to ascertain the functional status of CSF1RR549_E554delinsQ, we were unable to delineate the exact mechanisms by which this alteration resulted in downstream pathway activation. In vitro studies to assess sensitivity of CSF1R alterations to pexidartinib could not be performed because of the lack of appropriate preclinical models for studying the pathobiology of histiocytosis. Notwithstanding that shortcoming, the results of the in silico studies, RNA sequencing, IHC staining studies, and cell model expression studies showed convincing evidence that CSF1RR549_E554delinsQ was associated with preferential downstream activation of the PI3K-AKT pathway.
This case illustrates the limitations and challenges of targeted NGS studies, particularly in histiocytic neoplasms where the variant allele frequency may be very low.28 The success of NGS analysis, whether performed in a clinical or research setting, depends on various factors, including tumor tissue cellularity, reporting thresholds, and technical issues associated with biopsy and tissue processing. Although the CSF1RR549_E554delinsQ mutation was present in the first biopsy from our patient, it was below the validated threshold and was not reported. In the repeat biopsy, the alteration was above the reporting threshold but was categorized as a variant of unknown significance. Our independent analysis through in silico prediction, transcriptomics, histopathologic evaluation, and cell model expression studies provided evidence that this variant had clinical significance and was indeed targetable.
In conclusion, our report provides a proof-of-concept that targeting CSF1R is a potential strategy in the treatment of histiocytosis with CSF1R variants. Moreover, this case also shows that the PI3K-AKT pathway could be preferentially activated over the MAPK pathway, and for such patients, MEK inhibitors may not be beneficial. If a patient does not have variants in the MAPK pathway, a search for other variants should be undertaken and may even require a repeat tissue biopsy. We now propose including the CSF1R inhibitor pexidartinib as a potential treatment option for patients with histiocytic neoplasms harboring activating CSF1R variants, including alterations previously reported in the JM region.5, 16
ACKNOWLEDGMENTS
This work was supported in part by the University of Iowa/Mayo Clinic Lymphoma SPORE (CA97274), the Predolin Foundation Biobank (all), and by the Walter B. Frommeyer, Jr., Fellowship Award in Investigative Medicine, University of Alabama at Birmingham (G.G). June Oshiro, PhD, ELS, Mayo Clinic, provided editorial suggestions on an earlier draft of the manuscript.
CONFLICT OF INTEREST
The author declares that there is no conflict of interest.
AUTHOR CONTRIBUTIONS
Jithma P. Abeykoon, Terra L. Lasho, Surendra Dasari, Wasantha K. Ranatunga, Michelle K. Manske, Alexander Tisher, Karen L. Rech, Kevin E. Nowakowski, Xiaosheng Wu, Mrinal M. Patnaik, Thomas E. Witzig, Gaurav Goyal, and Ronald S. Go designed and performed experiments. Aishwarya Ravindran, Gordon J. Ruan, W. Oliver Tobin, Eoin P. Flanagan, Mithun V. Shah, N. Nora Bennani, Robert Vassallo, Jay H. Ryu, Matthew J. Koster, Caroline J. Davidge-Pitts, and Jason R. Young analyzed data, cared for the patient, and critically appraised the manuscript.
Open Research
DATA AVAILABILITY STATEMENT
The data that support the findings of this study are available from the corresponding author upon reasonable request.


