Semaphorin 7A: A novel marker of disease activity in Gaucher disease
Funding information: Agence Nationale de la Recherche, Grant/Award Number: ANR-18-IDEX-0001; LabEx GR-Ex, Grant/Award Number: ANR-11-LABX-0051
Abstract
Gaucher disease (GD) is a recessively inherited lysosomal storage disorder in which sphingolipids accumulates in the macrophages that transform into Gaucher cells. A growing body of evidence indicates that red blood cells (RBCs) represent important actors in GD pathophysiology. We previously demonstrated that altered RBC properties including increased Lyso-GL1 levels, dyserythropoiesis, and iron metabolism defect in GD patients contribute to anemia and hyperferritinemia. Since RBC defects also correlated well with markers of GD severity and were normalized under enzyme replacement therapy (ERT), the identification of molecules that are deregulated in GD RBCs represents an important issue in the search of pertinent markers of the disease. Here, we found a decreased expression of the GPI-anchored cell surface protein Semaphorin 7A (Sema7A) in RBCs from untreated GD (GD UT) patients, in parallel with increased levels of the soluble form in the plasma. Sema7A plays a role in neural guidance, atherosclerosis, and inflammatory diseases and represents a promigratory cue in physiological and pathological conditions. We showed that the decreased expression of Sema7A in RBCs correlated with their abnormal properties and with markers of GD activity. Interestingly, ERT restored the level of Sema7A to normal values both in RBCs and in plasma from GD patients. We then proposed that SemaA7A represents a simple and pertinent marker of inflammation in GD. Finally, because Sema7A is known to regulate the activity of immune cells, the increased level of soluble Sema7A in GD patients could propagate inflammation in several tissues.
1 INTRODUCTION
Gaucher disease (GD) is the most common lysosomal storage disorder and is caused by an autosomal recessive deficiency in the lysosomal glucocerebrosidase (GlCerase). This enzyme is required for the degradation of glycosphingolipids into glucose and ceramide. GD is divided into three clinical subtypes: GD type 1 is the chronic non-neuronopathic systemic form which displays hematological, bone, and visceral features. GD types 2 and 3 represent the acute and chronic neuronopathic form, respectively. GD type 1 is characterized by hepato-splenomegaly, anemia, thrombocytopenia, and complex skeletal manifestations (osteonecrosis characterized by bone micro-infarcts in ischemic regions and avascular necrosis).1 Complications associated with GD are due to the accumulation of GlCerase substrates that generate bioactive lipids in the cells of the monocyte lineage. Indeed, the lipid-laden macrophages that transformed into Gaucher cells are thought to be responsible for the major GD symptoms. Treatments are available for GD type 1 patients and target either enzyme replacement therapy (ERT) with recombinant GlCerase or substrate reduction therapy (SRT) by reducing glycosphingolipid products.
Biomarkers are very important for improved diagnosis, monitoring disease progression, and therapies. Chitotriosidase and CCL18 (chemokine [C-C motif] ligand 18) measurements were found to be useful for diagnosis, monitoring untreated patients, and assessing response to therapy.2-5 Since these markers are massively secreted from lipid-laden macrophages, they represent more relevant features of the macrophage hallmark rather than the entire physiopathology of GD.
More recently, glucosylsphingosine (Lyso-GL1)—a downstream metabolic product of glucosylceramide that is also degraded by the GlCerase—has been identified as a sensitive and specific biomarker for the diagnosis and monitoring of patients with GD.6, 7 Nevertheless, there is still a need for new biomarkers in response to treatment. There is also a need for additional therapeutic targets and for disease-related events and co-morbidities (eg, osteonecrosis, Parkinson) to allocate treatment to the appropriate patients.
Recent studies suggested that cells beyond macrophages might contribute to GD pathophysiology.8-11 We demonstrated altered properties in RBCs from GD patients that are normalized under ERT,12 strongly suggesting their involvement in the pathophysiology of the disease. Indeed, we showed that GD RBCs exhibited altered membrane morphology, deformability, and adhesion properties that could contribute to the occurrence of ischemic events in GD, that is, reduced micro-circulation.8, 12 We also recently reported a macrophage-independent dyserythropoiesis in GD,13 and a higher level of several sphingolipids in the RBCs of GD patients.14
In this context, we hypothesized that lipid overload in GD RBCs and/or in erythroid precursors may contribute to their abnormal properties. The identification of molecules or signaling pathways that are dysregulated in GD RBCs may lead to a better understanding of their role in GD. They could represent promising biomarkers and/or therapeutic targets in GD.
By investigating the expression of erythroid membrane proteins known to be involved in the cell adhesion processes, we found that only Semaphorin 7A (Sema7A) exhibited an altered expression at the red cell surface. Sema7A, also known as CD108, is a glycosylphosphatidylinositol (GPI)-anchored cell surface protein of 666 amino acids that is expressed in numerous cell types such as neurons,15 platelets,16 monocytes,17 T cells,18, 19 dendritic cells,20 endothelial cells,21 osteoclasts, and osteoblasts.22 In RBCs, Sema7A carries the John-Milton-Hargen (JMH) human blood group antigen.23 Several biological functions of Sema7A have been reported depending on the cell type including cell migration,20, 24 cell spreading, cell adhesion,25 macrophage activation, and induction of cytokine production.19, 20, 26 These processes required the interaction of Sema7A with its known membrane receptors plexin C1 and α1β1-integrin.19, 25 Alternatively, Sema7A could be cleaved to exhibit paracrine effects on other cells.17 Several studies demonstrated that a soluble form of Sema7A could act as a strong chemoattractant and stimulator of monocytes.17, 26 Sema7A might also participate in the development of diseases such as atherosclerosis,21 rheumatoid arthritis,17 lupus erythematosus susceptibility,27 and cancer progression.28
Here, we report the decreased expression of Sema7A in RBCs from GD patients compared to controls, and a concomitant elevation of the plasmatic Sema7A levels suggesting membrane shedding. We identified a strong correlation between Sema7A expression and the altered RBC membrane properties such as deformability and sphingolipid overload. To investigate the value of Sema7A as a new marker of GD, its expression in RBCs was analyzed in correlation with markers of severity in non-treated and ERT-treated GD patients.
2 METHODS
2.1 Patients
The patients were recruited prospectively between October 2010 and April 2015. Three centers participated in the study: Beaujon Hospital, Trousseau Hospital, Assistance Publique-Hôpitaux de Paris, and Saint Vincent Hospital, Lille, France. Blood samples were collected in an EDTA-containing tube from 33 GD patients (30 GD type 1 and three GD type 3 patients) and 11 healthy volunteers (over 18-year-old). None of the GD patients were splenectomized. The untreated group (GD UT) was composed of 18 patients who had never received ERT when the blood samples were collected. Twelve of these patients did not meet the criteria according to the guidelines of the French GD. The six remaining patients were treated with ERT at the time of blood sampling; the samples were collected just before or few weeks before the first infusion.
The ERT-treated group (GD ERT) included 15 patients treated with ERT for at least 1 year. These patients received recombinant enzyme intravenously every 2 weeks. The GD UT and GD ERT groups were analyzed and compared in the comparative study. Demographic characteristics and hematological and biological findings for the comparative study are provided in Suppl Table S1. Six of the 18 GD UT patients were followed for at least 6 months after starting the ERT treatment, and blood samples were collected throughout. The pre-ERT and post-ERT groups were analyzed and compared in the longitudinal study. Detailed demographic, clinical, and biological data concerning the longitudinal study are provided in Table S2. In Tables S1 and S2, clinical and biological data were provided by the hematologyʼ laboratories of the corresponding hospitals. This study was conducted in accordance with the Declaration of Helsinki and was approved by the local ethics committee.
2.2 Platelets-rich plasma (PRP) and RBC membrane preparation
Blood fractionation was performed with fresh blood samples in an EDTA vacutainer via centrifugation at 120g for 10 minutes. After centrifugation, the PRP (straw-colored fraction) was collected carefully from the top layer. Prostaglandin PGE1 (1 μM final concentration) and apyrase (0.2 U/mL final concentration) were added at each step to prevent platelet activation. A second centrifugation of 1200 g for 10 minutes was performed to isolate platelets in the pellet. The platelet pellet was then rinsed gently with platelet wash buffer (Tris-HCl 10 mM pH 7.2, NaCl 150 mM, Na2-EDTA 5 mM) containing prostaglandin PGE1 and apyrase. The final step was repeated once more. The platelet pellet was then lysed in lysis buffer (Tris-HCl 10 mM pH 7.2, NaCl 150 mM, Na2-EDTA 5 mM supplemented with n-ethylmaleimide 3.7 mg/mL, PMSF 200 mM). The RBC membranes from thawed erythrocytes were prepared by hypotonic lysis providing “white” ghosts.29 Cell lysis from PRP and ghosts were performed in laemmli buffer (2% SDS final concentration), and the total protein concentration was measured via a nanodrop and stored at −20°C until use.
2.3 SDS gel electrophoresis and western blot analyses
Equal protein amounts were analyzed for PRP and ghost analysis. Proteins were analyzed using 4%-12% bis-Tris acrylamide gel (Invitrogen) under reducing conditions, then transferred to a nitrocellulose membrane. We used the specific anti-human Sema7A monoclonal antibody (AF2068), biotinylated anti-human Sema7A antibody BAF2068 (R&D Systems, Minneapolis, MN), and anti-ACTIN (BD Biosciences, San Jose, CA). Protein expression was quantified using the quantity One Version 4.5.2 software (Biorad).
2.4 Isolation of PBMCs
Peripheral blood mononuclear cells (PBMCs) from 7 GD untreated patients were obtained from the Centre de Ressources Biologiques-Auvergne (Centre Hospitalo-Universitaire dʼEstaing, France), and PBMCs from eight healthy donors were used as controls. These were isolated 24 hours after blood collection using pancoll gradient separation (PAN Biotech, Aidenbach, Germany); these were then cryopreserved in SVF supplemented with 10% DMSO.
2.5 Flow cytometry analyses
After being collected on EDTA-containing tube, the plasma and RBCs were immediately frozen at −80°C and −196°C respectively as previously described.30 The RBC samples from different patients were thawed and resuspended in stabilizing agent ID-Cell stab (Bio-Rad, France). The solutions were centrifuged for 5 minutes at 490 g to remove the excess of ID-Cell stab and 1 μL of packed RBCs were resuspended in PBS. A total of 5.105 RBCs were used for each staining. We used monoclonal antibodies directed against the adhesion molecules CD29, CD36, CD49d, CD55, CD58, CD59, CD71, CD99, CD147, CD44, CD242, and CD108 (Becton, Dickinson and Company [BD Bioscience], Franklin Lakes, New Jersey) in association with retic count staining to discriminate membrane protein expression in reticulocytes and in mature RBCs. The specific monoclonal antibody PE-conjugated CD108 (clone KS-2, BD Bioscience) was used to quantify Sema7A expression in RBCs.
The expression of CD14, CD3, CD56, and CD19 was assessed to discriminate the different population of PBMCs according the following gating strategy: CD14+: monocytes; CD19+: LB; CD3+: LT; CD56+: NK; and CD3 + CD56+: NKT. Primary specific monoclonal antibodies were used (APC-conjugated CD14, clone M5E2, BD bioscience; APC-conjugated CD19 clone LT19, FITC-conjugated CD3 clone REA613, PE-Vio770 conjugated CD56 clone AF12-7H3, Miltenyi Biotec). The specific monoclonal antibody from BD Bioscience was used to assess the expression of Sema7a in each population type.
Corresponding isotypes were used as negative controls for all flow cytometry analyses. Prior to staining, cells were incubated in PBS supplemented in 2% BSA for 30 minutes at 4°C to block non-specific antibodies binding sites. They were then incubated with antibodies in PBS supplemented in 0.2% BSA for 30 minutes at 4°C. Acquisition was performed with a BD FACS Canto II flow cytometer (BD Bioscience); analysis used FlowJo software (Treestar, San Carlos, CA).
2.6 ELISA assays
The human Sema7A levels were measured in the plasma of 11 healthy subjects, 18 untreated GD (GD UT) patients, and 14 ERT-treated GD patients using ELISA according to the manufacturerʼs instructions (Uscn Life Science Inc, Houston, USA). The level of ADAM-17 and TNFα were measured in the plasma of 11 healthy subjects, 10 GD UT patients, and eight ERT-treated GD patients using ELISA according to the manufacturer (ThermoFisher Scientific, Waltham, MA USA and BlueGene, Shanghai, China, respectively).
2.7 Analyses of RBC properties
All experiments on RBC morphology and deformability were performed as previously described8, 12 within 4-6 hours of venipuncture to avoid blood alterations. Giemsa-stained blood smears were performed, and RBCs with abnormal morphologies (schistocytes, dacryocytes, elliptocytes) were quantified. The RBC deformability (EI, elongation index) was determined at 37°C at nine shear stresses ranging from 0.3 to 30 Pa via laser diffraction analysis (ektacytometry) using the laser-assisted optical rotational cell analyzer (LORRCA, Mechatronics).
The quantification of the sphingolipids Lyso-GL1 and sphingosine-1-phosphate (S1P) in plasma and in RBCs, sample preparation and lipid extraction were performed as described.14 Briefly, the RBC samples were thawed 24 hours before handling and resuspended in ID-CellStab buffer (Bio-Rad, France). The plasma samples were thawed just before lipid extraction. The total lipid extraction in RBCs and plasma was performed according to our previously described method.14 Quantification of sphingolipids were determined in nM based on our calibration curves. This value was then multiplied by the hematocrit (Htc) found in the patient at the time of sampling. The concentrations were therefore expressed in nmole per Liter of blood. For the concentration determined in the plasma, the nM concentration was multiplied by [1-Htc].
2.8 Statistical analysis
Non-parametric tests were used. For the comparative study, parameters were compared between three groups using a Kruskall-Wallis test followed by Dunnʼs post-test. We used a Mann-Whitney test when parameters were compared between two groups. The Wilcoxon signed-rank test was used to compare paired observations (longitudinal study). The Spearman correlation coefficient was used to determine the association between Sema7A expression and the sphingolipid content in RBC, their membrane properties, and the biological parameters of the patients. Fisherʼs exact test was used to analyze categorical data in small samples. All results are given as P values with P < .05 considered statistically significant.
3 RESULTS
3.1 Expression of Sema7A in RBCs and plasma from GD patients
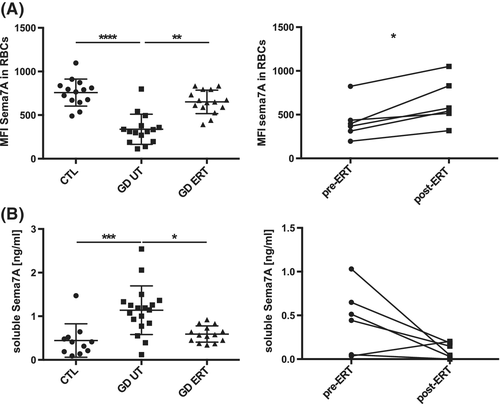
We used flow cytometry to study the expression of 12 membrane proteins expressed on the red cell surface. These are recognized as receptors or cell adhesion molecules. The RBCs from 18 GD UT patients and 11 controls were labeled with antibodies specific to these surface molecules. We only observed a decreased expression of Semaphorin 7A (Sema7A) on the surface of RBCs from GD UT patients vs controls (CTL) (mean fluorescence intensity, MFI ± SD, 758 ± 155 vs 338 ± 173; P ≤ .001) (Figure 1A left panel). This altered expression was also observed in the RBCs from two type II GD patients (data not shown). We compared Sema7A expression in RBCs from naïve GD patients and from patients treated by ERT for at least 1 year (GD ERT). Figure 1A showed that ERT treatment increased and normalized Sema7A expression (MFI ± SD, 651 ± 134) to control values (P ≤ .01). In addition, the longitudinal study performed for 6 GD patients, confirmed the significant increase of Sema7A expression in RBCs from the same patient before and 1 year after ERT (MFI ± SD 421 ± 213 vs 638 ± 260; P ≤ 0.05) (Figure 1A right panel).
We next performed western blot analyses to confirm the results obtained by flow cytometry. Similar results were observed in western blot experiments done on total erythrocyte membranes (ghosts) indicating that the decrease in Sema7A expression is not due to its mis-localization on the surface of the cell (Suppl. Figure S1A).
Previous studies demonstrated that shedding of Sema7A from the cell surface of the platelets resulting in elevated levels of soluble Sema7A.16 We next used ELISA to evaluate if the soluble form of Sema7A could be detected in a large cohort of GD patients (n = 33) vs healthy individuals (n = 11). Interestingly, we found a significant increase in the plasma of naïve GD patients vs healthy controls (mean ± SD 1.14 ± 0.56 ng/mL vs ± SD 0.44 ± 0.38 ng/mL; P ≤ .001) (Figure 1B left panel). Both the comparative and longitudinal studies showed that ERT treatment restored the level of soluble Sema7A to normal values (Figure 1B). Next, to determine whether RBCs could be a major source of Sema7A in plasma, we evaluated the correlation of Sema7A levels in plasma with those in RBCs (Figure S1B). We observed a significant correlation between the expression of Sema7A in RBCs and the level of its soluble plasmatic form (ρ = −0.51; P ≤ .001).
Sema7A is cleaved via the metalloproteinase ADAM-17 (ADAM metallopeptidase domain 17).16, 17 This increases its soluble form in vitro.16 ADAM-17 was initially characterized as responsible for the cleavage of the TNFα (tumor necrosis factor). Note, ELISA data from the GD patients showed elevated plasma levels of the sheddase ADAM-17 as well as TNFα in GD UT vs controls (Figure S2). Although not significant, we also measured a decreased plasmatic level of ADAM-17 and TNFα in ERT GD patients. All these data strongly suggested that ADAM-17 may contribute to the shedding of Sema7A in GD.
3.2 Expression of Sema7A in the other blood cells of GD patients
Sema7A expression has been reported in platelets and other blood cells. Thus, we investigated if its expression is also affected in other blood cells of GD patients such as PBMCs and platelets.
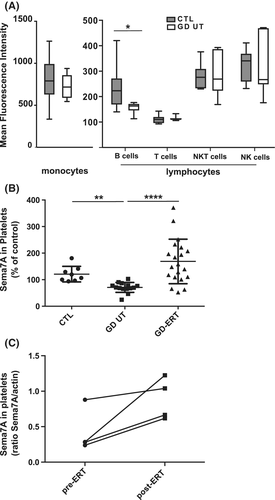
We then isolated PBMCs from whole blood and analyzed the expression of Sema7A in the different blood cell types by flow cytometry. Sema7A is highly expressed in monocytes and weakly expressed in lymphocytes. Among PBMCs, we observed a significant decreased expression of Sema7A only in B cells of the GD UT group compared to the controls (Figure 2A and Figure S3 for the gating strategy). We also prepared plasma-enriched platelets to evaluate Sema7A expression in circulating platelets by western blot analyses. We found that platelets from GD UT patients exhibited decreased levels of Sema7A vs controls (Figure 2B). The comparative and longitudinal studies—although performed with only four patients—showed that the ERT treatment restored Sema7A levels in platelets (Figure 2B,C). All these results suggested that Sema7A expression is deregulated in RBCs, platelets, and B cells of GD patients.
3.3 Decreased expression of Sema7A in RBCs correlates with their abnormal properties and their lipid content in GD patients
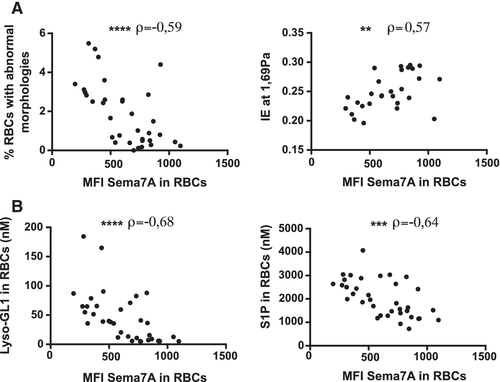
To better understand the role of Sema7A in RBCs in relationship with GD, we investigated potential correlations between Sema7A expression, and the abnormal properties of the red cells. Interestingly, we observed a decrease in the expression of Sema7A in RBCs that is strongly correlated with the percentage of RBCs with abnormal morphologies (ρ = −0.59; P ≤ .0001) (Figure 3A left panel). In addition, decreased expression of Sema7A on the red cell surface is correlated with a decreased deformability of RBCs (ρ = 0.57; P ≤ .01) (Figure 3A right panel). We also showed a strong correlation with lipid overload in RBCs—in particular Lyso-GL1 and sphingosine-1-phosphate (ρ = −0.68; P ≤ .0001 and ρ = −0.64; P ≤ .001 respectively) (Figure 3B). From these data, we concluded that the abnormal expression of Sema7A in RBCs is correlated to the defects observed in RBCs from GD patients.
3.4 Decreased expression of Sema7A in RBCs correlates with markers of disease activity
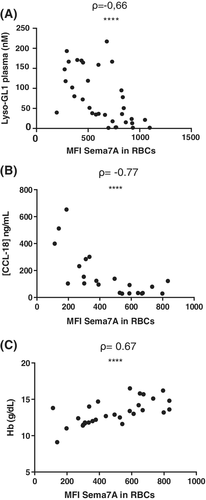
To further evaluate the potential significance of Sema7A expression in GD, we analyzed the correlations between clinical features in untreated-GD patients and Sema7A levels in RBCs. Interestingly, we found a negative correlation between the expression of Sema7A in RBCs and the markers of disease activity of GD such as the plasma level of Lyso-GL1 (ρ = −0.66; P ≤ .0001) and of the chemokine CCL-18 (ρ = −0.77; P ≤ .0001) (Figure 4A,B). Moreover, the level of hemoglobin (Hb) was positively correlated with Sema7A expression in RBCs (ρ = 0.67; P ≤ .0001) (Figure 4C). In contrast, there is no relationship between Sema7A levels in RBCs or plasma, and platelet counts (data not shown).
To determine biomarker properties of Sema7A in plasma and in RBCs in relation to plasma Lyso-GL1, we performed ROC analysis (Figure S4). We established that the area under the ROC curve (AUROCC) was 0.8516 for the soluble form of Sema7A (standard Error: 0,08380), 0.9464 for Sema7A expression in RBCs (standard Error: 0,04281) and an area value of 1 for plasma Lyso-GL1 (standard Error: 0,0001). Thus, the biomarker Lyso-GL1 appears much more discriminant then Sema7A. However, the comparison of these 3 ROC curves showed no significant differences between these biomarkers (not shown). A cut-off of 378 (MFI) of Sema7A expression in RBCs gave sensitivity and specificity of 81% in distinguishing between GD patients and healthy controls.
4 DISCUSSION
Semaphorins have been classically defined as axonal signaling cues involved in central nervous system development and in the modulation of the immune response. Sema7A plays a role in axon guidance via the MAPK pathway.15 Sema7A also regulates the immune response as Sema7A-defective mice have autoimmune disorders such as encephalomyelitis.19 Moreover, the JMH antigen has been associated with a clinically benign autoimmune disorder23 and more recently in lupus erythematosus susceptibility.27 Sema7A has also been described as a regulator of T cell activation19, 31 and an inhibitor of NK cell proliferation. Studies based on Sema7A-deficient mice demonstrated that the interactions between Sema7A and β1 integrin is crucial for T-cell-mediated macrophage activation at sites of inflammation. Sema7A can also enhance human monocytes and neutrophil migration.24, 26 There is also a clear effect of Sema7A on osteoblast migration in vitro as well as osteoblast differentiation suggesting an important role in bone cells homeostasis.22
To maintain proper bone density, bone remodeling must be regulated by an appropriate balance between osteoblasts and osteoclasts. Several studies showed that this mechanism involves the semaphorin/plexin system. In particular, Sema7A may induce and inhibit the differentiation of osteoblasts and osteoclast respectively22, 32 while also playing a role in osteoclast activity.33 Then, it was suggested that the regulation of the semaphorin signaling could be a target for treating bone-related diseases. The dysregulation of Sema7A in patients with GD suggests that this molecule could be investigated as a potential new therapeutic target to normalize bone cell homeostasis in this pathology, although this present study could not conclude on the relevance of Sema7A expression as a biomarker of bone lesions.
Herein, we measured higher concentrations of soluble Sema7A in the plasma of GD UT patients vs healthy controls. In addition, Sema7A membrane expression decreased in RBCs, platelets, as well as B cells, and plasma levels of Sema7A were negatively correlated with its expression in RBCs. We showed that the low levels of Sema7A in RBCs were highly correlated with CCL-18 and Lyso-GL1 plasma levels, anemia, and RBC defects. We also showed that ERT normalized Sema7A plasma levels as well as its expression at the RBC and platelet surface. The ROC characteristic of Sema7A in plasma and in RBCs suggested that it represents a potential biomarker but it is not as efficient as plasma Lyso-GL1 which represents the best-established biomarker known to be directly implicated in GD pathophysiology. However, it is noteworthy that measurement of Sema7A expression by flow cytometry directly on red blood cell (RBC) samples represents a very simple, rapid and accurate test.
The biological effects of Sema7A have been reported with both the soluble and the membrane forms.34 In our study, the decrease in membrane Sema7A in RBCs from GD patients strongly suggests that these cells are most likely the main source of soluble Sema7A. Deregulation of proteinase activity has already been observed in patients with GD that could contribute to the excretion of some proteins.35, 36 The biomarker gpNMB / osteocactivin allowing to discriminate patients with GD from healthy subjects have been recently discovered.37 As Sema7A, the soluble form of gpNMB is present in higher concentrations in the plasma of GD patients and the expression of this biomarker was also increased in the splenic macrophages of the patients. It was shown that the metalloproteinase ADAM-10 is most probably responsible for the release of the soluble form of gpNMB,38 and similar mechanism could also be involved for Sema7A. Indeed, previous experiments carried out with specific inhibitors of ADAM-17 demonstrated the involvement of this enzyme as sheddase.16, 17 Our results are in agreement with this hypothesis since we found that ADAM-17 sheddase is highly expressed in the plasma of patients with GD, suggesting that this metalloproteinase could contribute to Sema7A cleavage as well as that of the TNFα cytokine.39
One hypothesis is that soluble Sema7A could participate to neutrophil recruitment24 and activation of monocytes at the sites of inflammation26 to trigger an inflammatory response. Sema7A is also known to regulate the activity of other immune cells such as T cells, NK cells, neutrophils, and platelets in peripheral blood.19, 24, 26, 40 We then proposed that increased soluble Sema7A in GD patients could contribute to the production of inflammatory cytokines causing the recruitment of activated immune cells that propagate inflammation in several tissues of GD patients. More precisely, ADAM-17-induced Sema7A secretion could be part of a vicious cycle involving TNFα cytokine stimulating monocytes and macrophages in GD. Indeed, high production of TNFα by monocytes could contribute to macrophage phenotypic changes in GD patients. These alternatively activated macrophages could produce a significant amount of ADAM-17 inducing the shedding of Sema7A. This in turn could stimulate monocytes.34 In agreement with this hypothesis, we showed a clear relationship between the levels of Sema7A and CCL-18, which is considered as a biomarker of the Gaucher cell mass.
Future independent studies using larger cohorts and longitudinal follow-up are needed to validate Sema7A as a new biomarker of GD and to clarify the biological role of Sema7A in GD including inflammation and bone disease. We suggested that Sema7A could also be used as a routine blood test since it could represent a simple marker of GD activity especially for inflammation status.
ACKNOWLEDGMENTS
The authors thank the clinical research associates Karima Yousfi and Monia Bengherbia for their assistance in collecting GD patient data and Eliane Vera at the Centre National de Référence pour les Groupes Sanguins for the management of RBC samples. We thank Dr. Roland Jaussaud, Dr. Amelie Servettaz and Dr. Christian Rose for providing patient care.
We thank Arnaud Chene for discussion and advices. L.D. and N.R. were supported by a labex GR-Ex fellowship and/or scholarship. The labex GR-Ex, reference ANR-11-LABX-0051 is funded by the IdEx program “Investissements dʼavenir” of the French National Research Agency, reference ANR-18-IDEX-0001.


