Engineering Neural Tissue from Human Pluripotent Stem Cells Using Novel Small Molecule Releasing Microspheres
Abstract
Here a novel technique for engineering neural tissue consisting of motor neurons by combining human-induced pluripotent stem cells (hiPSCs) with small molecules releasing microspheres is demonstrated. First, the small molecule purmorphamine (puro) is successfully encapsulated into poly ε-caprolactone (PCL) microspheres using a single emulsion oil-in-water (o/w) method for the first time with an efficiency of (84% ± 2.12%). These microspheres release 91% ± 1.7% of the encapsulated puro in a controlled fashion over 46 days. Puro microspheres, along with previously characterized retinoic acid (RA) releasing microspheres, are then incorporated into hiPSC aggregates to engineer neural tissue. The combination of puro and RA microspheres promotes hiPSC differentiation as indicated by the expression of multiple neural markers, including the neuronal marker β-tubulin III (βT-III), and the transcription factor Olig2 (7.69 ± 8.38%) on day 28. These tissues express the motor neuron marker HB9 (24.85 ± 4.51%) on day 35, and the mature motor neuron marker ChaT (12.35 ± 4.17%) on day 60. These engineered tissues can be used for regenerative medicine applications such as treating spinal cord injury (SCI), disease modeling, and drug screening.
1 Introduction
Adult somatic cells can be reprogrammed back into a pluripotent state by expressing a specific set of transcription factors known as Yamanaka factors, which includes Oct3/4, Sox2, Klf4, and c-Myc.1 The resulting cells are known as human-induced pluripotent stem cells (hiPSCs).1 The discovery of hiPSCs provides intriguing possibilities for applications in regenerative medicine, tissue engineering, and disease modeling. hiPSCs can self-renew and differentiate into all three germ layers like human embryonic stem cells (hESCs). However, using hiPSCs avoids the controversial ethical issues associated with human embryo derived hESCs. Furthermore, hiPSCs can be more readily used for clinical treatment, as patient-derived hiPSCs reduce the risk of immune rejection when transplanted back into the original patient.2-4
Often cell culture conditions are manipulated to direct the differentiation of hiPSCs into the desired cell phenotypes. One such established differentiation method requires the formation of hiPSC aggregates to generate specific cell lineages.5-8 These aggregates self-organize into a structure, replicating the process of embryogenesis.7 The aggregates can be treated with morphogens to promote directed differentiation toward target lineages. Thus, ensuring diffusion of morphogens throughout the aggregate is essential to producing a homogenous population of the desired mature cell lineage. However, the 3D nature of the cell aggregates limits diffusion, meaning morphogens only reach the outer layers of the cell aggregate—resulting in heterogeneous differentiation.9, 10 Achieving homogeneous differentiation in vitro is necessary to for many in vivo applications, as undifferentiated stem cells pose a risk of tumor formation.11-13 An inside-out approach to morphogen delivery can address the issues of poor diffusion, and the resulting heterogeneous differentiation. This method requires embedding morphogen-loaded microspheres into cell aggregates, allowing for the targeted and controlled release of the required morphogen throughout the aggregate.14 Morphogen-loaded microspheres enable localized drug delivery in a temporally controlled manner for homogeneous and organized stem cell differentiation inside of aggregates.15, 16 Our group previously demonstrated that applying such a strategy by using retinoic acid (RA)-loaded microspheres led to high levels of neuronal differentiation for hiPSC-derived cell aggregates.17 Such homogeneous cell populations serve as a potential platform for in vivo studies to promote recovery and regeneration of cells affected by neurological disorders such as spinal cord injury (SCI).17
The spinal cord (SC), the most caudal component of the central nervous system (CNS), receives sensory information and contains motor neurons (MNs). These cells control voluntary muscle activity by conducting information from the central nervous systems to the rest of the body through the ventral horn of the SC.18, 19 The ascending and descending tracts of the nervous system are disrupted during traumatic SCI, causing major motor and sensory impairments to the patient.20 In addition to cell death due to the primary injury, the resulting inflammatory response produces an unfavorable environment for regeneration and disrupts the ionic balance of the surrounding tissue, which creates a secondary and irreversible injury.21, 22 The secondary injury can occur within minutes, day, or weeks, and it is characterized by events such as inflammation, ischemia, apoptosis, free radical production, and demyelination.21, 23 Furthermore, astrocytes surround the injury site, becoming reactive and forming a glial scar that serves as a physical barrier to regeneration.20, 21, 24 Thus, inducing axonal sprouting remains a major challenge when repairing the injured SC. Transplanting engineered neural tissues at the site of injury can potentially improve function by bridging the injury site to re-establish connectivity.19
Accordingly, research has focused on deriving MNs by exposing human pluripotent stem cells (PSCs) to the morphogens RA and sonic hedgehog (SHH) as these factors pattern the SC during development.8, 25 Puro, a hydrophobic small molecule agonist of the protein smoothened (SMO), induces SHH signaling, which generates oligodendrocyte transcription factor 2 (Olig2)—expressing progenitor cells that can become postmitotic MNs that express the protein homeobox 9 (HB9) and the transcription factor Islet1 (ISL-1). Thus, puro serves as a cost effective alternative to SHH when engineering neural tissue.8 Also, it is less sensitive to the microsphere fabrication process where the use of organic solvents can denature proteins like SHH. Additionally, puro treatment can generate functional MNs from hiPSCs when cultured in a 3D microenvironment—making it a powerful tool for stem cell engineering.26 However, no previous studies have characterized biomaterial-based systems for generating controlled release of puro—which we address in this work.
The purpose of this study is to generate neural tissues containing motor neurons by combining novel morphogen releasing microspheres with hiPSCs. Our drug delivery system addresses the shortcomings of currently existing protocols, which rely upon frequent media changes that result in heterogeneous cell populations. Although mechanical cell sorting can address the issue of heterogeneity in existing protocols, these methods require 3 to 4 additional weeks of in vitro culture, along with the added costs of cell sorting reagents and equipment.8 Drug-releasing hydrogels can deliver morphogens in an autonomous fashion in vivo, but they only deliver morphogens to the outer layers of the cells aggregates embedded inside.27 Building upon our previous work, we fabricated puro-releasing microspheres from poly ε-caprolactone (PCL), a synthetic low-cost hydrophobic polymer with excellent biocompatibility.28 We showed for the first time the successful encapsulation and controlled delivery of the small-molecule puro. These PCL-microspheres possessed an encapsulation efficiency (EE) of 84% ± 2.12% and they released 91 ± 1.7% of the encapsulated puro loaded over 46 days in a controlled fashion. Puro- and RA-loaded microspheres then were incorporated into hiPSC-derived cell aggregates to generate engineered neural tissues. Assessment of the differentiated cells was performed at four different time points using flow cytometry, immunocytochemistry (ICC), and measurements of neurite extension and branching. The microsphere-loaded neural tissues showed extensive and organized neurite outgrowth in comparison to positive controls in which soluble RA and puro were added directly to the media on a regular basis. Microsphere-loaded aggregates expressed higher levels of the transcription factor Olig2 (8.19%) in comparison to the positive control group (2.8%) on day 28 of culture. The microsphere-loaded aggregates expressed the MN related transcription factors HB9 (≈24.8%) and ISL-1 expression (≈2.6%) on day 35. Finally, these engineered neural tissues expressed choline acetyltransferase (ChAT) (≈12.3%) on day 60, indicating the presence of mature MNs.
2 Results
2.1 Characterization of Puro-Encapsulated Microspheres and Their Release Kinetics
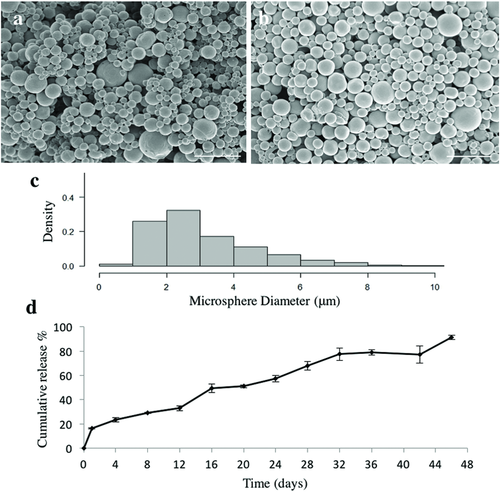
Scanning electron microscopy showed that puro-encapsulated microspheres possessed an average diameter of 3.4 ± 1.17 µm and exhibited a smooth rounded morphology (Figure 1a) similar to unloaded microspheres (average diameter previously reported as 2.24 ± 2.04 µm) (Figure 1b).29 The size distribution for the puro-loaded microspheres is shown in Figure 1c. Analysis determined that the encapsulation efficiency (EE) of puro into the microspheres was 84 ± 2.12%. In comparison, 4 µg mg−1 (w/w, RA/PCL) RA-loaded microspheres were previously reported to have an average diameter of 3.59 ± 2.48 µm with an EE of 60.9 ± 1.9%.17 16% of the total puro was released in an initial burst of drug release on Day 1 followed by slow, continuous release over the remaining 45 d. 91 ± 1.7% of encapsulated puro was released by day 46 (Figure 1d).
2.2 Microsphere Directed Differentiation of hiPSCs into Functional Neural Tissue
2.2.1 Combining Drug Releasing Microspheres with hiPSCs to Generate Neural Tissue
A previous study treated PSCs with 0.1 × 10⁻⁶ m RA beginning on day 10 followed by 1 × 10⁻⁶ m puro from day 15 on.8 Our lab tested different ratios for the combination of both drug-loaded microspheres on the differentiation of hiPSCs into MNs with a 2:1 ratio of puro/RA microspheres showing the most promising results for differentiation of hiPSCs into neurons as indicated by staining for the early neuronal marker β-tubulin III (βT-III). The positive control aggregates were initially treated with 2 × 10⁻⁶ m RA and 1 × 10⁻⁶ m puro for as previously reported,8 followed by a decrease over time to simulate the amount of drug being released from the microsphere group. Each group of aggregates was represented by a letter: positive control (P), negative control consisting of untreated aggregates (N), aggregates combined with unloaded microspheres (U), and aggregates combined with puro/RA loaded microspheres (M). The appearance of microspheres was evident in the U and M groups after one day in the AggreWell 800 plate. Consequently, U and M aggregates were larger than N and P aggregates by day 7 (Figure S1, Supporting Information).
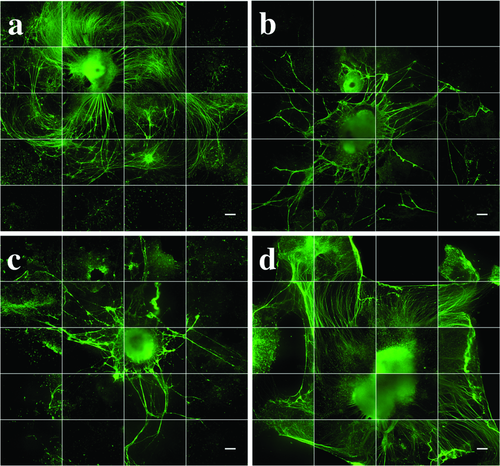
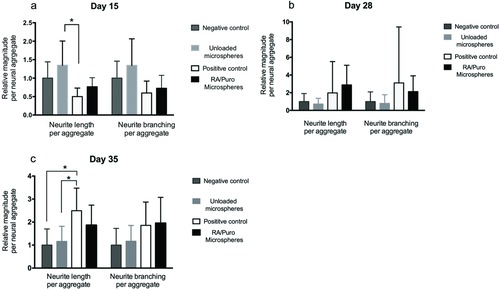
Figure 2 shows qualitative images of neurite growth and extension for all groups after 35 d. These aggregates were stained for the neuron-specific microtubule marker βT-III and then imaged using an IncuCyte automated imaging machine. M showed extensive, organized neurites (Figure 2a). Conversely, N and U showed reduced, disorganized neurite growth (Figure 2b,c). P possessed a larger aggregate area in comparison with M, and exhibited long, organized neurites (Figure 2d). Quantitative analysis of neurite growth and branching was performed using the NeuroTrack and Basic Analyzer configuration software on days 15, 28, and 35 on an IncuCyte ZOOM live-cell imaging system (Figure 3). U showed the greatest neurite growth and branching per aggregate area on day 15 in comparison with P (Figure 3a). P and M had developed greater neurite outgrowth and branching per aggregate area than N and U by day 28 (Figure 3b). This trend continued on day 35, where statistically significant differences in neurite branching per aggregate area were observed between P in comparison to the U and N groups (Figure 3c).
2.2.2 Analysis of Protein Expression in Day 15 Cultures
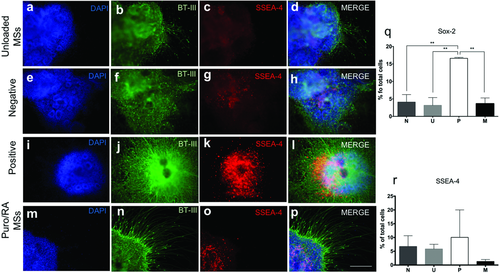
ICC was performed on all cultures at day 15 for βT-III, stage-specific embryonic antigen-4 (SSEA-4, pluripotency marker) and counterstained with 4′,6-diamidino-2 phenylindole (DAPI, nucleic acid marker). βT-III expression was expressed in all the conditions (Figure 4b,f,j,n). Neurite growth and extension was prominent in P and M. SSEA-4 was expressed in N, U, and M. P did not show SSEA-4 expression (Figure 4c,g,k,o). On day 15, aggregates were also stained for the paired box protein (PAX6, neuroectoderm marker) and Nestin (neural progenitor marker) with all the conditions being negative for these markers (data not shown). Flow cytometry was performed at the same time point to quantify cell marker expression. The expression of SOX-2 (neural progenitor marker) and SSEA-4 was quantified for all conditions (Figure 4q,r). P showed an increased expression of SOX-2 (16.61 ± 0.26%).
2.2.3 Analysis of Protein Expression in Day 28 Cultures
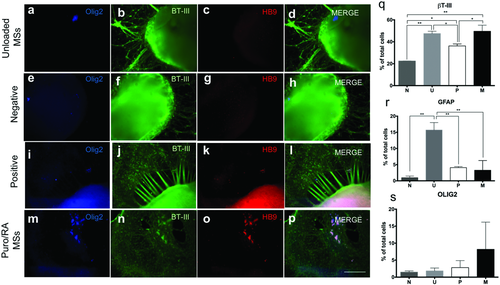
Cell aggregates were stained for βT-III, NeuN (a mature neuronal nucleus marker), and counterstained with DAPI on day 28 (Figure S2, Supporting Information). All conditions showed significant amounts of neurite growth as visualized by βT-III expression (Figure S2b,f,j,n, Supporting Information). P showed dense and organized neurites while M showed thinner, organized neurites. By comparison, neurites formed in N and U appeared disorganized. NeuN expression was positive for all conditions (Figure S2c,g,k,o, Supporting Information). In addition, cell aggregates were stained for Olig2 and HB9 (mature MN marker) on day 28 (Figure 5). Qualitative Olig2 expression was negative for N and U, slightly positive for M with high expression for P cultures. Slight HB9 expression was observed for the M and P groups. Quantitative marker expression was performed for SSEA-4, βT-III and Olig2 as well (Figure 5q,r). SSEA-4 expression was negligible for all groups. Expression of βT-III was observed for all groups. The quantitative expression of Olig2 for M was 8.19 ± 7.99% with no statistical differences observed.
2.2.4 Analysis of Protein Expression in Day 35 Cultures
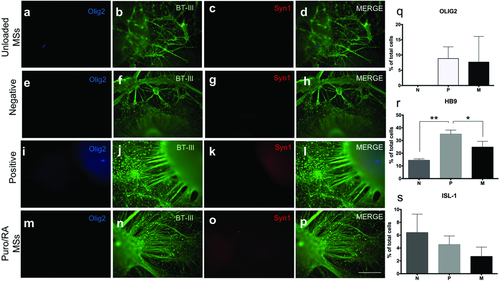
Expression of Olig2, βT-III, and Syn1 (presynaptic marker) was analyzed using ICC (Figure 6). The expression of Olig2 was slightly positive for P and negative for the other groups. Syn1 staining was negative for all conditions. βT-III expression was observed in conjunction with neurite outgrowth for all conditions. U exhibited the least neurite growth extension and no organization. P and M show extensive and organized neurites (Figure 6b,f,j,n). Quantitative expression of Olig2, HB9, and ISL-1 (mature MN marker) on day 35 was analyzed using flow cytometry. Increased expression of Olig2 (8.83 ± 3.84%) was observed for P in comparison with day 28. M showed similar levels of Olig2 expression on days 28 and 35. The P group showed enhanced levels of HB9 on day 35 in comparison to other groups. The N group showed a higher expression of ISL-1 (6.4 ± 2.86) by day 35 (Figure 6s) in comparison to other groups.
2.2.5 Analysis of Protein Expression in Day 60 Cultures
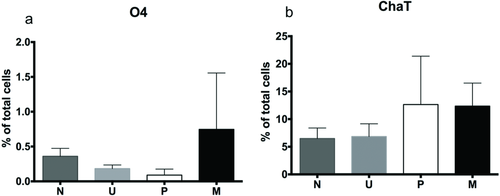
The expression of mature neural markers, O4 (oligodendrocyte marker), and ChaT (MN neurotransmitter marker), were quantified on day 60 (Figure 7). ChAT expression was similar for P (12.63 ± 8.74) and M (12.35 ± 4.17). O4 and Sy38 expression were negligible for all groups.
3 Discussion
In this study, we successfully encapsulated the small molecule puro in microspheres capable of generating its sustained release over 46 days for the first time. These microspheres were then incorporated into a novel microsphere-based protocol for the efficient derivation of MNs from hiPSC aggregates. Compared to previous methods, this protocol avoids selection steps and allows for the sustained release of puro, lowering the amount of drug required. The EE of puro into the microspheres (84%) was higher than previously reported of other encapsulated drugs like RA (60.0%)17 and guggulsterone (42.4%),29 and similar to Clonazepam (72.6–95.1%)30 and tamoxifen.31 The average microsphere diameter size was 3.4 ± 1.17 µm, similar in size to unloaded and RA-loaded microspheres with diameters of 2.24 ± 1.04 µm and 3.59 ± 2.48 µm, respectively.17, 29 The amount and size of microspheres serve as important parameters for the sustained delivery of morphogens when combined with cell aggregates. In particular, Carpenedo et al. reported that smaller microspheres in a range of 2–5 µm allow for a better incorporation within the cell aggregates,27 while Gomez et al. reported that an excessive numbers of microspheres disrupts cell-to-cell interactions required for cell survival, proliferation, and differentiation.17 The total amount of microspheres per cell aggregate used in this study was optimized previously based on aggregate formation, survival, and differentiation (Figure S1, Supporting Information).17, 29 The microspheres used (puro, RA, and unloaded) all fell within the ideal size range for incorporation into cell aggregates.
The release study for puro was performed over 46 days to analyze the effect of the drug and microspheres on hiPSCs when exposed for >35 d, which is the time period reported by Hu and Zhang for differentiating immature MNs.32 An initial burst release of puro was observed during the first 24 h. This initial effect often occurs when delivering small molecules from polymeric materials, and it can be attributed to the increased surface-to-volume ratio of the small particles.33 68% of the encapsulated puro was released by day 28, which was higher than the levels of RA released at the same time point (28%). By day 44, (≈87%) of puro was released. 91 ± 1.7% was released by the end of day 46 (Figure 1d) which corresponds to 2.2 µg of puro released every day from 10 mg of microspheres. 0.3 mg of puro-loaded microspheres were added to the cell aggregates. Therefore, ≈0.0748 µg of puro was released on average per day into the aggregates.
The overall release profile was linear as regression analysis gave an R2 value of 0.95, which was similar to the observed release profile of encapsulated Taxol in poly (l-lactic acid) (PLLA) microspheres by Liggins et al.34 This response is also consistent with other studies where linear or near-linear release profiles for smaller microspheres 30–50 µm,33-35 while larger microspheres of 50–100 µm generate a sigmoidal release profile as reported by Kim et al.33
For the P group, an average amount of puro of 0.38 µg total was used per day of media change for the first 46 d of the study. Media changes were performed every day from day 0–7, followed by media changes every third day. Our differentiation method microspheres to deliver puro requires significantly smaller quantitates of puro than traditional differentiation protocols. Moreover, microsphere incorporation proves another advantage by leading to efficient differentiation similar to the protocol reported by Hu et al.25 This group reported the expression of HB9+ (10–23%) from the differentiation of iPSCs after selection of neuroepithelial (NE) cells and treatment with soluble RA and SHH for 2 weeks.25 In contrast, by allowing the cell aggregates to form in combination with the drug-loaded microspheres, the inside layers of these aggregates are directly exposed to the morphogens that are continuously released. Our approach yields tissues with significant expression of HB9 after 35 d. This protocol provides an efficient method of differentiation by generating similar levels of MN marker expression with less manipulation and smaller quantities of drug. On the other hand, our P group, where only the outside layer of the cell aggregates is in direct contact with the drug, resulted in concentration gradients and less efficient differentiation as indicated by low HB9 expression.
Quantitative analysis of neurite length and branching was performed for days 15, 28, and 35. The number of branches and neurite length was larger for P and M groups on day 28. Results for neurite growth on day 35 were as expected where extensive, organized neurites extended from the cell aggregate for both P and M treatments. The length of neurites per aggregate area was larger for the P group than the M group, while neurite branching was similar for both groups. N and U groups showed lower levels of neurite length and branching. These results suggest that the constant presence of both morphogens promotes neurite branching and extension.
The positive control group P stained 10.05 ± 9.95% for SSEA-4 on day 15. Negligible levels of the pluripotency marker SSEA-4 were observed for all groups by day 28 as opposed to day 15, suggesting that the exposure and sustained release of these morphogens from day 1 contributes to induced differentiation. Elimination of undifferentiated cells is crucial for the translation of laboratory protocols into clinic. The low expression of SSEA-4 indicates the mature differentiation of the cell aggregates into neural tissues. The quantitative analysis of SOX-2 (another pluripotency marker) at this stage showed (3.62 ± 1.65%) of total cells in the aggregates treated with M, (3.17 ± 2.21%) of cell aggregates with U, (4.09 ± 2.16%) for N, and (16.56 ± 0.34%) in the P. The high expression for P could be attributed to a neuronal precursor state, whereas similar lower levels of expression in the other groups can be attributed to a more pluripotent state on day 15.36, 37
Unlike the results reported by Zhang et al., we did not observe expression of the neural progenitor markers PAX6 and Nestin, possibly due to a difference in protocols. We used drug releasing microspheres instead of the addition of soluble morphogens to the culture media. Furthermore, neural rosettes were not selected in this study as such a selection process could not be implemented in vivo. Additionally, our study exposed hiPSCs to sustained release of RA and puro starting from day 1, while Zhang et al. added these molecules at day 10 and 15, respectively. It is hypothesized that these markers were expressed earlier during this protocol of differentiation. βT-III expression was expressed for all groups by day 28, M, P, and U showed the higher levels of expression in comparison with N. In addition, the expression of the glial fibrillary acidic protein (GFAP) which is a marker expressed in astrocytes was analyzed at this time point. The levels of expression were (3.28 ± 2.98) for M, (5.16 ± 0.33) for P, (1.13 ± 0.53) for N, and (15.71 ± 2.31) for U. Other studies have shown that astrocytes can regulate the development and functional maturation of hiPSC-derived neurons.38 However, in this study the glial population for P (5.16 ± 0.33) and M (3.28 ± 2.98) was found to be low in comparison with U (15.71 ± 2.31) that had the highest level of expression for GFAP (Figure 5r). The lower expression of GFAP for P and M can be attributed to the constant presence of puro and RA in the media that promoted MN differentiation.
The expression of Olig2, a transcription factor expressed in MN progenitors, was also analyzed on day 28. The latter occurs when expression of the MN phenotype markers HB9 and ISL-1 upregulate and Olig2 expression levels downregulate.8, 39, 40 The quantitative expression with flow cytometry showed (8.19 ± 7.99%) of total cells were expressing Olig2 in cell aggregates combined with puro- and RA-loaded microspheres. Olig2 expression is lower in comparison to the marker expression stated by Zhang et al., potentially due to the differences in protocols and lack of purification steps in our method. Furthermore, the qualitative ICC expression of Olig2 appeared to be negative for all groups except for an increased expression for P and slightly for aggregates with M. By day 35, the quantitative expression of Olig2 was upregulated for P and was similar on day 28 for M and was followed by the expression of HB9 and Isl1. Zhang et al. have reported 10–23% HB9 positive expression from differentiated IPSCs by day 35 after the addition of RA and SHH at specific time points and several selection steps.25 In this study, we report 24.8 ± 4.5% of cells staining positive for HB9 for the M group. The qualitative analysis of Syn1, a protein expressed in the synaptic vesicles required for neurotransmitter release, was negative for all groups. These results are not surprising, as maturation of MN for another 3–4 weeks is required for neurotransmitter release and signal transduction.32, 41, 42
After 8 weeks of culture in vitro, quantification of the cell marker expression of the oligodendrocyte phenotype (O4), the myelinating support cells of the nervous system, was negligible for all groups. On the contrary, the expression of ChaT, an enzyme that catalyzes the production of the neurotransmitter acetylcholine which is found in cholinergic neurons such as MNs, was expressed twice as much in M (12.35 ± 4.17%) and P (12.63 ± 8.74%) in comparison with other groups. Synaptophysin (Sy38), the most abundant integral membrane protein of small synaptic vesicles and an important regulator of synaptic plasticity,41 was not expressed at this time point. These results suggest that the drug-loaded microsphere treatment has similar capabilities as the positive group to produce mature MNs derived from hiPSCs after 8 weeks of culture in vitro, however, further maturation might be required for the expression of Sy38. In the future, the expression of ChaT and Sy38 as well as the electrical activity of mature MNs differentiated with puro- and RA-loaded microspheres can be analyzed in both monoculture and as a coculture in a substrate of myoblast cells as suggested by Zhang et al. to demonstrate their ability to form functional neuromuscular junctions.
The end goal of this work is to produce an engineered tissue that could be delivered as a cell therapy for treatment of SCI by combining patient-derived hiPSCs with drug loaded microspheres. In the absence of in vitro purification techniques, efficient derivation of the desired cell phenotype is an important limitation to in vivo hiPSC therapies.43, 44 For this reason, any techniques that could not be implemented in vivo, such as the selection of neural rosettes, were not performed in this study. We addressed this limitation by using a novel inside-out approach in which morphogens are released within the aggregates allows for efficient MN differentiation from neural aggregates. A second major limitation yet to be addressed is the immunogenicity of hiPSCs, which must be deeply understood prior to implementation of hiPSC-derived therapies. For example, Zhao et al. have demonstrated differential immune responses to hiPSC-derived smooth muscle cells versus retinal pigmental epithelial cells, suggesting that immunogenicity of other hiPSC-derived phenotypes may vary between cell lines.45
Another potential use for these drug-loaded microspheres is the differentiation in both 2D culture and in 3D printed tissues, which would avoid the laborious work of frequently adding the soluble morphogens in the media. Our novel puro-loaded microspheres could be incorporated in bioinks used during 3D printing of tissue. 3D bioprinting has the potential to make tissue engineering automated and replicable while minimizing human intervention. These 3D printed neural tissues can be used as drug screening tools and to create physiologically relevant disease models.
4 Conclusion
We have developed and characterized the first biomaterial-based system for controlled release of the small molecule puro. We then successfully incorporated a mixture of puro- and RA-loaded microspheres into hiPSC aggregates that differentiated efficiently into mature motor neurons. This work confirms the value of drug-releasing microspheres as a tool for engineering neural tissue and illustrates its potential for in vivo applications. Such microspheres can also be used as an alternative to constantly adding soluble puro during media changes when performing neural differentiation of PSCs in vitro. Future work includes evaluating these engineered tissues in vivo as way of promoting regeneration in a preclinical model of SCI.
5 Experimental Section
Fabrication of Small Molecule Releasing Microspheres: Microspheres were fabricated using a single emulsion oil-in-water (o/w) protocol followed by the evaporation of the organic solvent dichloromethane (DCM) (Fisher Scientific) as previously described.17 A poly(vinyl alcohol) (PVA) solution (2%) (Mw ≈ 13 000–2 3000, Sigma-Aldrich) was made as previously described.29 Briefly, PVA was dissolved in deionized water at 50 °C constantly stirring with a magnetic stir bar. PCL (321 mg) (Mn ≈ 45 000, Sigma-Aldrich) was dissolved in (3 mL) DCM in a (25 mL) Erlenmeyer flask on a Corning PC-420D magnetic mixer for 15 min at 900 rpm. An adapted stopper covered with PTFE tape (TaegalSeal) was placed on top of the flask to avoid evaporation. Puro stock solution was prepared by diluting the drug in 100% ethanol to make a stock concentration (190.2 × 10⁻⁶ m) (Cayman Chemical). Before adding the drug, the stock solution was warmed up to room temperature, the drug was added (0.3 mg) to the oil phase to make the final concentration (0.93 µg mg−1) of microspheres (w/w, puro/PCL). After the addition of the drug, 2% PVA (3 mL) was added to the oil phase, the solution was then emulsified on a vortex mixer for 30 s at maximum speed. Once emulsified, the solution was delivered into the water phase at 35 °C and stirred at 500 rpm for 4 h. The solution was centrifuged at 3000 rpm (Eppendorf 5810R) and washed with deionized water to collect the microspheres. The pellet was and frozen at −20 °C and then lyophilized. RA-loaded and unloaded microspheres were prepared as previously described.17, 29
Microsphere Characterization Using Scanning Electron Microscopy: Microsphere characterization of size and shape was performed using the Hitachi S-4800 FE scanning electron microscope (SEM) as done previously.17, 29 The microspheres (0.1 mg) were placed into a microtube with 100% ethanol (50 µL) and mixed vigorously with the vortex mixer. The solution was placed on the SEM stub mount (2 µL). The sample was coated using a gold-palladium using the Anatech Hummer VI sputter coater. Images were obtained with an accelerated voltage of (1.0 kV) and a working distance of (8 mm). The microspheres' size was determined using ImageJ software—version 1.48. A minimum of 600 microspheres were analyzed for each batch of microsphere characterization. The density plot of microsphere data was produced using R studio software.
Determination of Encapsulation Efficiency and Characterization of Controlled Release of Purmorphamine: A 46 d release study was performed to determine the release kinetics of puro. Each sample of microspheres (10 mg) and (1 mL) PBS was placed on microtubes (1.5 mL, Axygen). Samples for each day of collection (n = 3) were placed on a VWR mini shaker at 330 rpm at 37 °C and were collected every 4 d. After collection, samples were washed with deionized water and freeze dried for further analysis. The drug was extracted from the microspheres and then quantified with high-performance liquid chromatography (HPLC) to estimate puro concentration in the microspheres. 10 mg of microspheres was placed in microtubes (1.5 mL) by triplicate. To melt the microspheres, 250 µL of acetonitrile (ACN) was added and mixed with the vortex mixer at 3000 rpm for 30 s (Caledon Laboratory Chemicals). The samples were then placed on the vortex mixer (Eppendorf MixMate) at 2500 rpm for 5 min. 250 µL ACN was added to the sample followed by the same mixing procedure to obtain a final volume of 500 µL. The samples were then placed at −80 °C for 5 min, followed by centrifugation (Eppendorf 5424) at 1500 rpm for 5 min. The samples were filtered using 0.2 µm PTFE syringe filters (Thermo Fisher Scientific) before adding the supernatant to amber vials (Agilent). HPLC was performed using an Agilent 1200 equipped with quaternary pump and diode-array detector (DAD) to quantify the amount of puro present in samples. A standard of puro with 11 dilutions of a stock solution diluted in ACN was used to determine the concentrations of the samples. The column used was an Eclipse Plus C18 (Agilent) with 5 µm particle size, 4.6 mm internal diameter (ID) and was 150 mm long with similar phase and ID guard column. Samples were analyzed at 300 nm after determination of the spectrum of puro with mass spectroscopy. Mass spectral information was acquired using an Ultimate 3000 HPLC system connected to an Orbitrap (Thermo Fisher Scientific). The system was used in direct infusion mode with no separation. Solvents used for this analysis were HPLC grade ACN mixed with water dispensed from a Milli-Q integral purification system (Millipore, ON, Canada). Both contained 0.1% (V/V) trifluoroacetic acid (TFA) (Fisher Scientific). Runs were done isocratic at a 70%:30% ratio, respectively, with and injection volume of (20 µL), flow rate of (1 mL min−1) at 21 °C. ChemStation software was used for data analysis with autointegration adjusted manually when needed. EE was determined as previously described29 by comparing the amount of puro encapsulated (Pencapsulted) to the amount of drug initially added (Ptheoretical).
hiPSC Culture and Formation of Engineered Tissues: Experiments using hiPSCs were conducted with the approval of the University of Victoria's Human Ethics Committee under protocol number: 12–187. hiPSCs (iPS(Foreskin)-1, Lot 1-DL-01, WiCell) were cultured in six-well plates coated with Vitronectin XF in the presence of E8 medium (STEMCELL Technologies) until 80% confluency was reached as previously described.46 Eleven confluent wells were used for the formation of uniform cell aggregates in AggreWell 800 plate (STEMCELL Technologies) as previously described.29 Four conditions were tested: unloaded microspheres, 2:1 Puro/RA microspheres, negative control group, and positive control group 2:1 Puro/RA soluble drugs added from day 1. For the microsphere groups, a total of (0.5 mg) of microspheres was suspended in STEMdiff NIM (STEMCELL Technologies) and were incorporated into the aggregates to make a total volume of (2 mL) per AggreWell 800 well. Negative group cultures contained no microspheres, nor soluble drug. Positive group cultures contained final puro concentration of 1 × 10⁻⁶ and 0.5 × 10⁻⁶ m RA. Media changes were performed by replacing (1.5 mL) of STEMdiff NIM with 1% penicillin streptomycin (PenStrep) (Sigma-Aldrich) every day until day 7. On day 7, cell aggregates were transferred to each well of a poly-l-ornithine (PLO)/laminin coated 24-well plate (Sigma-Aldrich). The number of cell aggregates in each well ranged from 2 to 5. Cell aggregates were cultured in (1 mL) STEMdiff NIM and media changes were performed every third day by replacing (500 µL) with fresh media. By day 16, puro and RA concentrations for the positive group were decreased to (0.5 × 10⁻⁶ m) and (0.25 × 10⁻⁶ m) respectively. BrainPhys Neuronal Medium (STEMCELL Technologies) gradually replaced STEMdiff NIM and by day 25 each well contained 100% BrainPhys Neuronal Medium. In order to promote MN differentiation BrainPhys was supplemented with N2(1%), B27(1%), cyclic-AMP (c-AMP) (1 × 10⁻⁶ m), Ascorbic acid (AA) (200 ng mL−1) (Sigma-Aldrich), BDNF(10 ng mL−1), GDNF(10 ng mL−1), IGF-1(10 ng mL−1) (Peprotech), and PenStrep(1%).25
Analysis of Cell Cultures Using Flow Cytometry: Cell marker expression was quantified with flow cytometry on days 15, 28, 35, and 60. Aggregates were enzymatically dissociated with (0.125%) trypsin-EDTA (Fisher Scientific) for 2 min at 37 °C followed by the addition of TNS (ScienCell). The resulting cells were washed three times by adding PBS (Invitrogen) and centrifuging at (600 g) for 5 min. The cells were then fixed and stained per the manufacturer's instructions (R&D systems). Expression of SSEA-4 (pluripotency marker) (FAB1435, R&D) and SOX-2 (pluripotent cells and undifferentiated cells in the neural epithelium) (IC2018P, R&D) was evaluated on day 15. Expression of βT-III (IC1195C, R&D), GFAP (astrocyte marker) (NBP2-33184PCP, Novusbio), and Olig2 (MN progenitor marker) (IC2230P, R&D), was evaluated on day 28. Flow cytometry was performed to evaluate expression of Olig2, HB9 (mature MN) (bs-11320R, Bioss antibodies) and ISL-1 (mature MN) (562 547, BD Pharmingen) on day 35. Expression of O4 (FAB1326P, R&D), ChAT (ab2803, Abcam) and Sy38 (ab8049, Abcam) was evaluated on day 60. Isotype controls for flow cytometry consisted of mouse IgG1 fluorescein-conjugated antibody (IC002F), mouse IgG2A PerCP-conjugated Isotype control (IC003C), normal mouse IgM PE-conjugated Control (IC015P) (R&D Systems) and Isotype Control (ab91366, Abcam).
Analysis of Cell Cultures Using Immunocytochemistry: Cell cultures and engineered tissues were stained for various markers according to the ICC protocol previously published.29, 46-48 Table S1 (Supporting Information) shows the antibodies, catalogue number, vendor, and dilution used for ICC analysis on days 15, 28, and 35. Cell aggregates were stained for βT-III (1:500), SSEA-4 (1:250), PAX6 (1:500, neural precursor marker) and Nestin (1:500, NSC marker) on day 15. On day 28 the cell aggregates were stained for βT-III (1:500), NeuN (1:1000), HB9 (1:1000), Olig2 (5 µg mL−1). ICC was performed using βT-III (1:500), Syn1 (1:200), Olig2 (5 µg mL−1), and HB9 (1:100) on day 35. All the primary antibodies were diluted in 5% normal goat serum (NGS) blocking solution (Sigma-Aldrich) and incubated overnight. Cells were then washed three times with PBS and incubated with the secondary antibodies for 4 h at room temperature. Finally, the cells were washed three more times and counterstained with DAPI (nuclear stain) with a 3 min incubation at room temperature. Cell cultures were imaged with a Leica DMI3000 B microscope using a XCite Series 120Q fluorescent light source and QImaging RETIGA 2000R camera with 100X magnification. Captured images were done using QCapture Software 2.9.12. Composite images were created using the image-processing program ImageJ with the Magic Montage tool.29
Analysis of the Morphological Properties of Engineered Tissues: Neurite growth and branching metrics were performed using the IncuCyte ZOOM (Essen BioScience) automatic live-cell imaging system as previously reported.17, 29 The cells were imaged by an IncuCyte ZOOM, and these images were processed using a software module called NeuroTrack that uses an algorithm to mask and analyze neurite length and branching. It has been validated for a variety of neuronal types with a sensitivity equivalent to that of an immunofluorescence-based, high content imaging assay. The NeuroTrack software module was used to process the images, previously stained with βT-III, on days 15, 28, and 35. For day 15 cultures, neurite aggregate analysis was performed using the Basic Analyzer processing definition. Briefly, a processing definition was created for the analysis by selecting a collection of images taken at the same magnification (10×). The settings for adjusting the proper segmentation for the cell body cluster area were first customized for each of the images selected from the image collection. Appropriate parameters were adjusted to differentiate cells from the background of the phase image. These settings were used to mask the entire neural aggregate body (center of sphere where neurites extend outward from). By masking this region as cell body cluster area, the algorithm calculates the neurite extension start point from the neural aggregate body. Neurite mask parameters were defined by adjusting the neurite sensitivity and preventing background noise and debris for every image of the image collection. For day 28 and 35, the processing definition was created by adjusting thresholds to mask the cell body cluster area and selecting the green fluorescence channel to visualize neurite labeling (βT-III). Once all the images were previewed, the processing definition was saved, and the metrics of average neurite length and branch points were recorded. A collection of 36 images per well was taken and the creation of the montage was done with Image J.
Statistics: All data are reported as the mean ± standard deviation of the mean. Puro EE and release study results (n = 3), microsphere size (n = 600), flow cytometry and ICC (n = 3), neurite extension and branching (n = 6) with 1–5 cell aggregates per well. Cell aggregates from N were used to normalize the data against U, P, and M groups for the quantitative analysis of neurite extension and branching. Statistical significance was assessed using one-way ANOVA followed by Tukey's post-hoc analysis with confidence levels of 95% (p < 0.05) and 99.9% confidence (p < 0.001). Statistical analysis for puro EE and release study results was performed using Microsoft Excel. The density plot of microsphere data was produced using R studio software. Flow cytometry data were obtained using the Guava Incyte software and the statistical analysis was performed using GraphPad prism 6 statistics software. Statistical analysis for neurite growth and branching was also performed using GraphPad prism 6 statistics software.
Acknowledgements
L.D.l.V. was supported through the Mitacs Globalink Graduate Fellowship award. K.K. was supported through the Mitacs Globalink research internship. S.M.W. holds support for this work, including the NSERC Discovery grant program, a Stem Cell Network Commercialization Impact grant, and the Canada Research Chairs program. The authors acknowledge the Advanced Microscopy Facility and the Mass Spectrometry Facility at the University of Victoria for their support. The authors acknowledge Meghan Robinson, Andrew Agbay, Marie Schulze, Krista Wilson, and Laila Abelseth from the Willerth laboratory for their assistance. L.D.l.V. performed most of experimental work and design and wrote the manuscript draft. K.K. helped to perform experiments and assisted on writing the initial manuscript. S.M.W. provided input into experimental design and provided feedback and editing on the manuscript.
Conflict of Interest
The authors declare no conflict of interest.


