Glycosylation Gene Signatures as Prognostic Biomarkers in Glioblastoma
Funding: This work was supported by National Natural Science Foundation of China: 82301543. Joint Funds for the Innovation of Science and Technology, Fujian Province: 2024Y9123, Fujian Provincial science and Technology Innovation joint Fund Project: 2021Y9149, Leading Project Foundation of Science and Technology, Fujian Province: 2021Y0013.
Tong Zhao, Hongliang Ge, and Chenchao Lin are regarded as co-first authors.
ABSTRACT
Objective
Glioblastoma (GBM) is an aggressive brain tumor characterized by significant heterogeneity. This study investigates the role of glycosylation-related genes in GBM subtyping, prognosis, and response to therapy.
Methods
We analyzed mRNA expression data and clinical information from The Cancer Genome Atlas (TCGA) and Gene Expression Omnibus (GEO) databases. Glycosylation-related genes were selected for differential expression analysis, sample clustering, and survival analysis. Immune cell infiltration and drug sensitivity were evaluated using CIBERSORT and oncoPredict, respectively. A prognostic model was constructed with Lasso regression.
Results
GBM samples were stratified into two glycosylation-related subtypes, showing distinct survival outcomes, with higher glycosylation expression correlating with poorer prognosis. Immune microenvironment analysis revealed differences in T-cell infiltration and immune checkpoint expression between subtypes, indicating variable immunotherapy responses. The prognostic model based on glycosylation genes demonstrated significant predictive value for patient survival.
Conclusion
Glycosylation-related gene expression contributes to GBM heterogeneity and is a valuable biomarker for prognosis and treatment stratification. This study provides insights into personalized treatment approaches for GBM based on glycosylation-related molecular subtypes.
1 Introduction
Glioblastoma (GBM) is a highly invasive and malignant brain tumor primarily affecting adults aged 50–70 years [1-3]. Its genetic heterogeneity and resistance to treatment make the prognosis poor, with median survival typically under 15 months [4-8]. Despite treatment efforts, including surgery, radiation, and chemotherapy, high recurrence rates remain a major challenge [9, 10]. Accurate tumor assessment is essential for personalized treatment [11, 12].
Glycosylation is a crucial cellular post-translational modification process that influences protein folding, stability, and bioactivity [13]. In oncology, glycosylation is vital in tumor cell survival, proliferation, migration, and immune evasion [14-18]. Unlike normal cells, tumor cells exhibit an aberrant glycosylation pattern, potentially leading to disrupted cell-to-cell communication and abnormal cell behavior, thereby promoting tumor progression [19, 20]. For instance, specific glycosylation changes have enhanced tumor cell interaction with the extracellular matrix, thereby increasing their invasive capabilities [21-23]. Additionally, glycosylation alters antigens, promoting immune evasion [24]. Glycosylation plays a key role in the immune microenvironment of GBM, promoting immune evasion and tumor progression. Myeloid-derived suppressor cells upregulate immune checkpoints and release matrix metalloproteinases, inhibiting T-cell infiltration and promoting tumor angiogenesis [25]. Additionally, hexosaminidase B-driven glycolysis-dependent tumor growth suppresses T-cell infiltration [26]. The glycosylation state of immune checkpoints affects their function and expression, further regulating immune responses and promoting immune evasion.
The genetic heterogeneity of GBM is one of its most challenging characteristics and a primary reason for treatment failure [27]. Various genetic and expression subtypes exist within tumors, potentially leading to different treatment responses [1, 28, 29]. Therefore, understanding these genetic differences is crucial for devising personalized treatment plans and improving prognosis [30]. For example, overexpression of the small GTPase RAB42 is linked to poor prognosis, immune cell infiltration, and chemotherapy resistance [31]. In recent years, researchers have extensively analyzed GBM using high-throughput sequencing technologies, identifying a multitude of relevant gene mutations and expression patterns, providing a scientific basis for molecular classification of gliomas [32-34]. This molecular subtyping approach not only aids in comprehending the tumor's biological behavior but also guides more targeted treatment strategies.
With the advancement of bioinformatics and the establishment of public genetic databases, researchers can now utilize rich data resources available in databases such as The Cancer Genome Atlas (TCGA) and Gene Expression Omnibus (GEO) to conduct comprehensive analyses of gene expression in GBM [35]. Through these analyses, researchers can better identify key genes and pathways that affect tumor behavior [36-38], build relevant models [39], and stratify and manage patient risk [40] or predict tumor prognosis effectively [41]. Notably, the heterogeneity in the expression of glycosylation-related genes has shown unique value in tumor classification and prognosis assessment [42-44]. Employing bioinformatics tools such as limma for differential expression analysis, ConsensusClusterPlus for sample clustering, and CIBERSORT and oncoPredict for evaluating immune infiltration and drug sensitivity are indispensable components in modern cancer research [45, 46].
This study explores glycosylation-related gene expression heterogeneity in GBM for classification and prognosis. Using TCGA and GEO data, we identify key genes and develop a prognostic model to enhance clinical assessment and guide personalized therapy.
2 Materials and Methods
2.1 Acquisition and Preprocessing of Affymetrix U133a mRNA and Clinical Data in GBM
The Affymetrix U133a mRNA dataset and corresponding GBM clinical data were obtained from the TCGA database (https://portal.gdc.cancer.gov/), with additional gene expression and clinical data from GEO (https://www.ncbi.nlm.nih.gov/gds/) for comparative analysis. Raw data underwent formatting, removal of non-expressed values, and missing data handling. Normalization and standardization were performed using the limma R package, employing the quantile method and robust multi-array average (RMA) algorithm to enhance comparability across platforms. Clinical data preprocessing ensured consistency and integrity by standardizing sample identifiers.
2.2 Multidimensional Analysis Methods for Glioma Subtype Discrimination and Validation
This study utilized the limma R package to perform differential gene expression analysis on glioma samples, identifying differentially expressed genes (DEGs) with |fold change| > 1.5 and p_adj < 0.05 (Table 1). ggplot2 and pheatmap were used for volcano plot and heatmap visualization (Table 2). Biological pathway activity was assessed using ssGSEA in the GSVA package [47], and glycosylation-related gene expression matrices were clustered using ConsensusClusterPlus to identify disease subtypes. Clinical data were then integrated, and survival analysis was performed using the log-rank method. Gene set enrichment analysis (GSEA) was applied to detect significant pathway differences between groups, providing deeper insights into disease mechanisms.
| Data information | Difference threshold | Number of differencing genes | Number of samples | ||||
|---|---|---|---|---|---|---|---|
| Data source | Platform | FC | P_adj | Up | Down | Cluster1 | Cluster2 |
| TCGA-GBM | Microarray | 1.5 | 0.05 | 74 | 751 | 132 | 116 |
| Gene | log2FoldChange | p-value | p adj | Cluster1 | Cluster2 |
|---|---|---|---|---|---|
| DCX | 1.4045 | 9.43 e − 08 | 9.60 e − 07 | 7.5043 | 6.0997 |
| RP11-35 n6. 1 | 1.2732 | 6.15 e − 06 | 4.05 e − 05 | 8.2930 | 7.0198 |
| TMSL8 | 1.2707 | 3.78 e − 05 | 2.00 e − 04 | 8.5687 | 7.2980 |
| DLX5 | 1.1764 | 1.36 e − 11 | 3.31 e − 10 | 5.3699 | 4.1935 |
| C20orf42 | 1.1225 | 2.49 e − 10 | 4.56 e − 09 | 6.5533 | 5.4308 |
2.3 Selection and Validation of Prognostic Marker Genes in Glioma Based on Lasso Regression
In this study, clinical samples were randomly divided into training and validation sets at a 7:3 ratio. The training set was used for model construction, while the validation set assessed model performance. Lasso regression analysis was conducted using the glmnet package, which is effective for high-dimensional data and prevents overfitting by selecting key predictive variables [48]. A 10-fold cross-validation approach was applied, where training data were split into 10 subsets, with 9 used for training and 1 for validation in each iteration. This process was repeated 10 times, and results were averaged to evaluate model stability and predictive performance. During training, Lasso regression identified prognostic marker genes, and their regression coefficients (Table 3) were used to develop a risk-scoring model. The model's prognostic performance was validated using survival analysis and ROC curve evaluation, confirming its predictive accuracy and clinical relevance.
| Gene | p-value | Hazard_Ratio |
|---|---|---|
| MRC2 | 0.0057 | 1.49 |
| LGALS1 | 0.0419 | 1.33 |
| COLEC12 | 0.0318 | 1.36 |
| LGALS3BP | 0.0256 | 1.38 |
| CLEC7A | 0.0162 | 1.41 |
| CLEC5A | 0.0134 | 1.42 |
| LY75 | 0.0168 | 1.41 |
| GPC4 | 0.0352 | 1.35 |
| SLC2A10 | 0.0332 | 1.36 |
| CHI3L2 | 0.0219 | 1.38 |
| CLEC2B | 0.0257 | 1.37 |
| FMOD | 0.0250 | 1.38 |
| SRGN | 0.0063 | 1.48 |
| RENBP | 0.0022 | 1.55 |
2.4 Research and Application of Methods for Immunological Microenvironment Characteristics and Drug Sensitivity Assessment
This study used the CIBERSORT method to assess immune cell infiltration in each sample based on gene expression values, evaluating the tumor microenvironment (TME). Correlation analysis of immune cell scores provided insights into immune interactions and regulatory relationships. Differences in immune scores among disease subtypes and treatment response groups were analyzed to characterize immunological variations. To evaluate drug sensitivity, the oncoPredict R package was applied using gene expression data and the GDSC2 database, calculating drug response differences (T.EST) between sample groups. T cell inflammation scores were computed based on inflammation-related gene coefficients and expression levels, and the Wilcoxon rank-sum test (Wilcox. test) was used to assess response heterogeneity. Tumor immune escape potential was predicted using the Tide tool, assigning scores based on gene expression. Wilcoxon tests were performed to compare expression differences across sample groups. Lastly, TME scores were calculated with the TME score package, and Wilcoxon tests were used to analyze variations across cancer subtypes.
2.5 Inter-Sample Gene Mutation Comparative Analysis Method Based on Maftools
This study analyzed gene mutation data for each sample, comparing mutation variations between groups using the maftools package. Statistical analyses, including mutation burden, spectrum, and hotspot mutation identification, were conducted to identify key mutation features and potential biomarkers. Visualization tools such as mutation frequency plots and clustering graphs facilitated interpretation.
2.6 Construction of Column Line Charts
The “survival” package was used for univariate and multivariable Cox regression analyses to identify independent risk factors and generate a glioma forest plot. Risk scores were integrated with other prognostic features for clinical interpretation. The “rms” and “regplot” functions were then applied to create predictive nomograms illustrating 1-year, 3-year, and 5-year mortality rates in glioma patients.
2.7 GSEA For Risk Overview
In this study, we conducted an enrichment analysis using the GSEA software version 4.1.0 to gain insights into the functions and pathways of glycosylation-related genes in GBM. Our criteria for filtering included normalized enrichment scores (NES) of 14, nominal p-values (NOM p-val), and false discovery rates (FDR q-val). Specifically, we set the thresholds as |NES| > 1, NOM p-val < 0.05, and FDR q-val < 0.25 to identify significant enrichments.
2.8 Cell Culture
The U251 and U87 glioma cell lines were obtained from the Department of Zoology at Kunming Medical University and cultured to generate derivatives. These cell lines, derived from glioblastoma patients, retain certain tumor biological characteristics and serve as representative models for glioblastoma research. Cells were maintained in 10% fetal bovine serum (FBS, Hyclone, USA) and 1% penicillin–streptomycin solution (PSS, Hyclone, USA). Before passaging, cells were rinsed with phosphate-buffered saline (PBS, Hyclone, USA) and detached using 0.25% trypsin (1–2 mL, Gibco). Digestion was stopped with complete culture medium, followed by centrifugation (800–1000 rpm, 5–8 min) and resuspension. The cell pellet was re-seeded in T25 flasks (4 × 10⁵ cells/mL, 3 mL) and incubated for further cultivation.
2.9 Small Interfering RNA (siRNA) Transfection Assay
siRNA is a key tool for gene silencing, facilitating target RNA cleavage within the RISC system to suppress gene expression. The RIBO siRNA used was modified with 5′ cholesterol and 2′O-methyl (2′OMe) (sequences in Table 4). Before transfection, riboFECT CP buffer (10×) was diluted in PBS to 1×, and riboFECT CP reagent was vortexed and equilibrated to room temperature. siRNA solutions (50, 75, 100 nM) were prepared in 1X buffer, then mixed with riboFECT CP reagent to form transfection complexes, which were added to cell cultures. After 48 h, RNA was extracted for RT-qPCR validation to determine the most effective concentration. Cells were incubated in a 37°C CO2 chamber for 48 h to evaluate siRNA silencing efficiency and cell viability.
| Gene | siRNA sequence |
|---|---|
| COLEC12 | CACAATGTACCAAATGTAAAAAT |
| LY75 | CTGATTACACAGCAATAGCTATC |
| CLEC5A | CCCCAAAGACTGGGAATTTTATC |
| GPC4 | ACGTTACAAGAAGTTTGATGAAT |
| RENBP | AACTCTGTCTGGCTTCCTAGAGG |
| SRGN | TTCTGGGCAGGGTTTGAGGTTTT |
| FMOD | TCCTCTCTCACACGTTCTCCAAC |
2.10 Cell Counting Kit-8 (CCK-8) Detection
Cell viability post-transfection was assessed using the CCK-8 assay. Cells were harvested during the logarithmic growth phase, and cell suspensions were adjusted to a density of 3000 cells per well by adding 100 μL to each well of a 96-well plate for subsequent cell testing. The cells were then incubated in a 5% CO2, 37°C humidified incubator for 24 h. After transfection with various concentrations of interfering RNA, the plate was returned to the incubator for 48 h. Subsequently, 10 μL of CCK-8 solution was added to each well, and the plate was further incubated in the cell culture incubator for 2 h. The absorbance of each well was measured at 450 nm using an enzyme reader. Cell viability was calculated as [(experimental well—blank well)/(control well—blank well)] × 100%.
2.11 Clonogenic Assay Method
A 6-well plate was prepared for the clonogenic assay, with 1000 cells seeded per well. The plate was incubated for 2 weeks under optimal conditions, allowing colonies to form. After incubation, cells were washed with PBS to remove non-adherent cells, then fixed with 4% paraformaldehyde (15–30 min). Staining with crystal violet (10–20 min) was followed by a PBS wash to remove excess dye. Colonies were observed and counted under a microscope to assess cell proliferation and clonogenic potential, providing a visual indication of growth.
2.12 Transwell Assay
Following a co-cultivation period, Transwell assays were conducted using a 24-well Transwell plate (Corning, USA, 3422). Subsequently, 700 μL of complete culture medium was added to the wells of the 24-well plate, while 100 μL of serum-free medium containing 3.0 × 10⁴ cells was placed in the upper chamber. Matrigel solution (Corning, USA, 356,234) was utilized for invasion assays.
2.13 Mice and Tumor Models
Eight-week-old male BALB/c-nu nude mice were obtained from the Chinese University of Hong Kong (Shenzhen) Experimental Animal Center (CAFSZ). For the intracranial tumor model, mice were anesthetized with isoflurane (RWD, Shenzhen, China) and positioned in a digital stereotaxic apparatus (RWD). After exposing the cranial bone at the injection site (+0.7 mm anterior, −2.0 mm lateral), U87 cells (2 × 10⁵, 5 μL) were injected 3 mm deep and left in place for 10 min. Mice were euthanized on day 12, and brain tissues were extracted. Each brain was coronally sectioned, and HE staining was performed to locate tumors. The largest tumor cross-section was selected for size measurement, with tumor volume calculated as V = (D × d2)/2, where D and d represent the longest and shortest diameters, respectively, measured using ImageJ software.
2.14 Statistical Analysis
Biological data from Affymetrix microarrays were processed using Affy or oligo R packages for background correction, normalization (RMA method), and probe-level summarization. Quantile normalization was applied using normalizeBetweenArrays in limma. Differential expression analysis was conducted with linear models and empirical Bayes methods, with Benjamini-Hochberg correction to control the false discovery rate. GSEA was performed using clusterProfiler or fgsea. ConsensusClusterPlus was used for sample clustering to identify disease subtypes. Kaplan–Meier estimation and log-rank tests assessed survival differences. Lasso regression (glmnet package) was applied, selecting the optimal lambda via cross-validation. Predictive performance was evaluated using an independent validation set, with C-index and ROC curve analysis. CIBERSORT determined immune cell proportions, while oncoPredict analyzed drug sensitivity (IC50 comparisons) among subtypes. Maftools was used for mutation analysis, including mutation frequency, spectra, and hotspot identification. Statistical comparisons were conducted using Student's t-test and Wilcoxon rank-sum test. Results were presented as mean ± standard deviation, with graphical representations including Kaplan–Meier curves, box plots, and bar graphs.
3 Results
3.1 Analysis of Glioma Subtypes Based on Glycosylation-Related Genes and Their Prognostic Implications
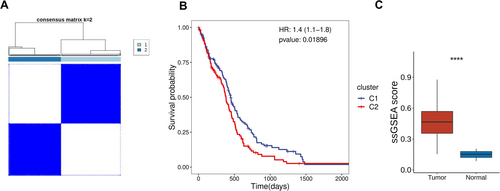
K-means clustering (ConsensusClusterPlus) based on glycosylation-related gene expression classified TCGA-GBM samples into two subtypes (Figure 1A). Survival analysis revealed significant prognostic differences, with Cluster 2 patients exhibiting poorer outcomes, suggesting that glycosylation gene expression patterns may be linked to glioma malignancy (Figure 1B). ssGSEA analysis further showed that glycosylation-related gene transcriptional activity was significantly higher in tumor tissues compared to adjacent tissues, underscoring the critical role of glycosylation in glioma progression (Figure 1C).
3.2 Molecular Characteristics and Immune Microenvironment Discrepancies in Glioma Subtypes Analysis
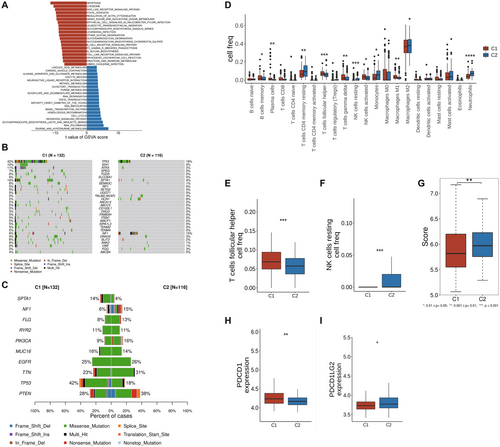
Utilizing the GSVA method, the TCGA-GBM samples were subjected to pathway enrichment analysis based on the KEGG gene set. It was observed that compared to cluster 1, cluster 2 exhibited significantly increased activity in APOPTOSIS, LYSOSOME, and NOD-like receptor signaling pathways (Figure 2A). Additionally, analysis using maftools revealed that cluster 2 displayed higher mutation frequencies in genes such as PTEN, TTN, and PIK3CA, indicating notable differences in molecular features (Figure 2B,C). Analysis of immune cell infiltration through CIBERSORT scoring and the Wilcoxon test showed that cluster 2 displayed elevated levels of helper T cells and resting NK cell infiltration (Figure 2D–F). The T cell inflammation score calculation based on T cell inflammation-related genes indicated significantly higher scores in cluster 2, suggesting a potentially better response to immune therapy in these patients (Figure 2G). Moreover, further expression analysis of immune checkpoint genes supported these findings by demonstrating a significant decrease in PDCD1 expression and a substantial increase in PDCD1LG2 expression in cluster 2, key immune checkpoint genes (Figure 2H,I).
3.3 Analysis of Survival and Proportion Differences Among Different Tumor Subtypes Under IDH Mutation Status
Patients were classified as IDH-mutant or IDH wild-type based on clinical data. Survival analysis showed that IDH-mutant patients had a significant survival advantage in certain tumor subtypes (Figure S1A). Sankey diagram analysis revealed the distribution of squamous cell carcinoma and adenocarcinoma across tumor subtypes and their association with survival status, highlighting the link between IDH mutation and subtype-specific survival outcomes (Figure S1B).
3.4 Construction of a Prognostic Model for Glioma Based on Glycosylation-Related Genes and Its Clinical Validation
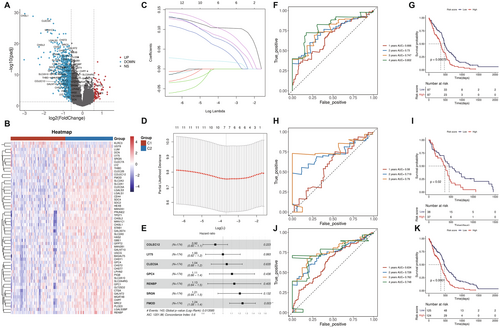
This study analyzed gene expression differences between cluster 1 and cluster 2 using the Limma R software package on the TCGA-GBM sample set. Cluster 1 showed 864 upregulated genes and 1300 downregulated genes compared to Cluster 2 (Figure 3A). Among these, glycosylation-related genes were significantly upregulated in cluster 1, indicating their potential role in tumor biology (Figure 3B). Univariate Cox regression identified glycosylation-related genes with significant prognostic value (p < 0.05), forming the basis for a prognostic model (Figure 3C). Cox regression and Lasso regression were further used to optimize gene selection (Figure 3D and Figure 3E), ultimately identifying 7 key marker genes (COLEC12, LY75, CLEC5A, GPC4, RENBP, SRGN, FMOD). The prognostic model, based on these genes, demonstrated strong predictive performance (AUC > 0.7), with significant survival differences between high-risk and low-risk groups (Figure 3F–K).
3.5 Analysis of Immune Microenvironment and Immune Checkpoint Expression Differences in High and Low-Risk Glioma Patients
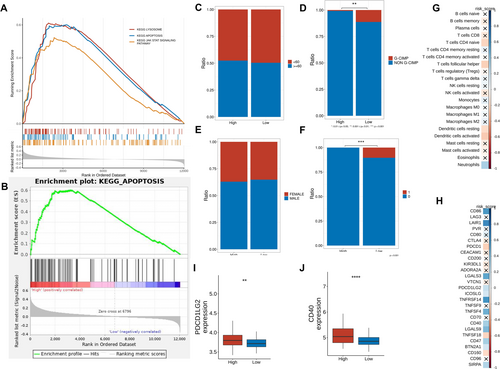
Enrichment analysis revealed significant marker gene enrichment in lysosomes, apoptosis, and JAK–STAT signaling, with apoptosis pathway enrichment particularly prominent in high-functional gene expression data (Figure 4A,B). CIBERSORT analysis (TCGA-GBM) showed significant differences in immune cell infiltration, with higher levels of helper T cells and activated NK cells in the high-risk group (Figure 4C–H). Immune checkpoint analysis identified elevated PDCD1LG2 and CD274 expression in high-risk samples, suggesting potential sensitivity to immune checkpoint inhibitors (Figure 4I,J).
3.6 Study on Drug Sensitivity Analysis, T Cell Inflammation Score, and Tumor Mutation Burden TME Score
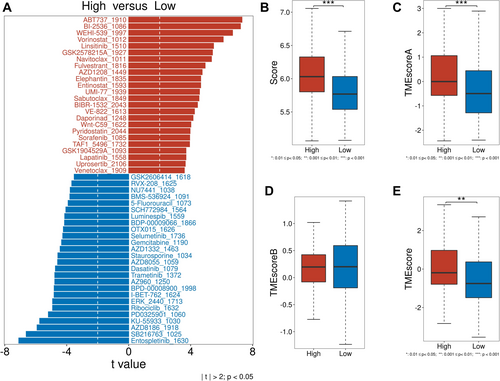
To assess the role of glycosylation in glioma treatment, drug sensitivity, T cell inflammation score, and TME score were analyzed. Drug sensitivity analysis (oncoPredict, GDSC2) revealed that high-risk group drugs included vorinostat, fulvestrant, and lapatinib, while low-risk group drugs included gemcitabine, dasatinib, and trametinib (Figure 5A). T cell inflammation scores, derived from TCGA gene expression, positively correlated with clinical immunotherapy response. TME scores (TMEscore package) were significantly higher in the high-risk group (Figure 5B). TMEscoreA (immune-related genes) was elevated in the high-risk group and correlated with immunotherapy efficacy, while TMEscoreB (stromal-related genes) showed no significant difference (Figure 5C–E).
3.7 Inhibitory Effects of Glycosylation-Related Genes on the Viability of Glioma Cells U87 and U251
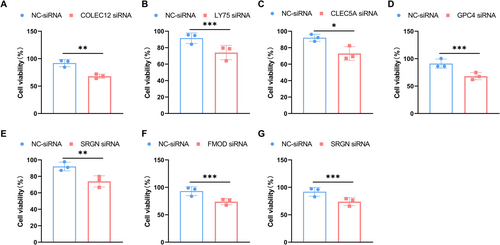
We investigated the roles of seven glycosylation-related genes, namely COLEC12, LY75, CLEC5A, GPC4, RENBP, SRGN, and FMOD, in the viability of glioma cells (U87 and U251 cells). Existing literature suggests that CLEC5A, GPC4, SRGN, and FMOD play key roles in GBM progression, with their modulation affecting tumor growth, migration, and prognosis, while the other genes remain unreported [49-52]. To investigate the impact of these seven glycosylation genes on glioma progression, we first confirmed the knockdown efficiency of these genes at the protein level (Figure S2A–G). Using the CCK-8 assay, we assessed the effects of silencing these genes on the viability of U87 and U251 cells. The experimental results indicate a significant inhibition of cell viability in U87 cells upon silencing these genes (Figure 6A–G). Furthermore, the silencing of COLEC12, LY75, CLEC5A, GPC4, RENBP, SRGN, and FMOD genes also notably reduced the cell viability of U251 cells (Figure S3A–G).
3.8 Functions of COLEC12, LY75, CLEC5A, GPC4, RENBP, SRGN, and FMOD Genes in Glioma Progression
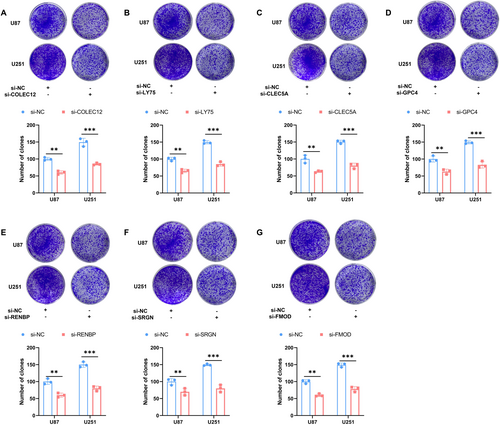
This study used clonogenic assays to investigate the roles of COLEC12, LY75, CLEC5A, GPC4, RENBP, SRGN, and FMOD in glioma development. Downregulation of these genes significantly reduced the clonogenic capacity of U87 and U251 cells (Figure 7A–G), highlighting their essential role in maintaining tumor stemness and clonogenic potential in glioma cells.
3.9 Study on the Functions of COLEC12, LY75, CLEC5A, GPC4, RENBP, SRGN, and FMOD Genes in Glioma Cell Invasion and Migration
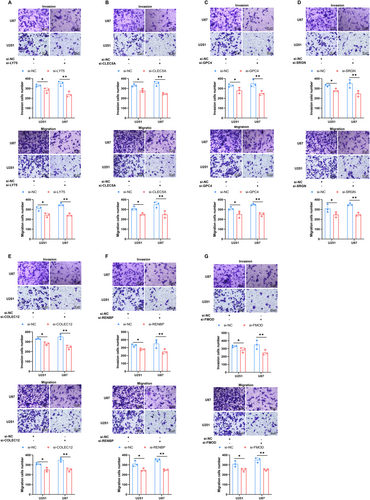
This study investigated the roles of COLEC12, LY75, CLEC5A, GPC4, RENBP, SRGN, and FMOD in regulating glioma cell invasion and migration. Gene knockdown in U87 and U251 cell lines significantly reduced their invasion and migration abilities, underscoring the crucial role of these genes in sustaining the invasive and migratory potential of glioma cells (Figure 8A–G).
3.10 Role of COLEC12, LY75, CLEC5A, GPC4, RENBP, SRGN, and FMOD in a Mouse In Situ Glioma Model
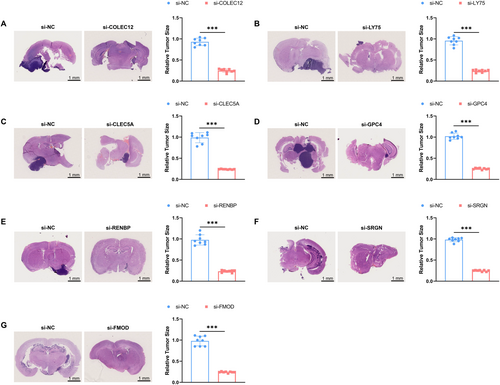
To further explore the roles of COLEC12, LY75, CLEC5A, GPC4, RENBP, SRGN, and FMOD genes in glioma development, this study established a mouse in situ glioma model using U87 cells. By silencing these genes, we compared the tumor growth in the brains of gene-silenced mice with those in the control group (NC group). The research findings indicate a significant suppression of tumor growth in the brains of mice injected with U87 cells after silencing these seven genes, highlighting their importance in glioma development (Figure 9A–G).
3.11 Analysis of Prognostic Model Reactivity in Glioma Patients Under Bevacizumab Treatment
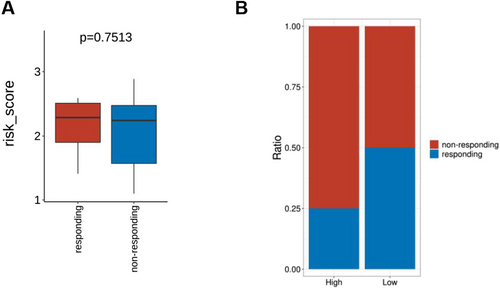
Initially, there were no significant differences in risk values pre- and post-Bevacizumab treatment between the responder and non-responder and high- and low-risk groups (Figure 10A). Subsequently, based on patient risk scores, the samples were divided into high-risk and low-risk groups, further analyzing the differences in proportions of patients responding to treatment versus non-responders in these two groups using a chi-square test (Figure 10B).
4 Discussion
GBM is an extremely aggressive brain tumor where glycosylation processes play a crucial role in tumor growth and spread [53, 54]. Glycosylation, as a vital cell post-translational modification, not only impacts protein stability and function but also influences cell-to-cell signaling and cellular interactions with the extracellular matrix by altering molecular properties on the cell surface [53-55]. Research indicates that glycosylation variations can lead to immune evasion and drug resistance, affecting treatment outcomes [53-55]. Despite extensive studies on the Role of glycosylation in other types of cancers, such as breast and lung cancer, its precise mechanisms and effects in GBM remain unclear [56, 57]. In this study, we discovered a close association between the heterogeneity of Glycosylation gene expression and GBM subtypes and prognosis, aligning with previous research on the Role of glycosylation in tumor development. However, our findings offer new insights and data to support the specific implications of GBM.
This study leveraged high-throughput gene expression profiling and bioinformatics to classify GBM samples into two subtypes based on Glycosylation gene expression, enhancing understanding of GBM heterogeneity and informing treatment strategies. Compared to traditional morphology-based or single biomarker classification, comprehensive gene expression analysis offers greater precision. Unlike previous studies focusing on proliferation and apoptosis-related genes, this study highlights Glycosylation genes in tumor classification, providing new perspectives and research directions.
The expression levels of Glycosylation genes are significantly correlated with the prognosis of GBM patients, providing a scientific basis for applying Glycosylation genes in prognosis assessment. Patients with high expression of Glycosylation genes have a poorer prognosis, possibly due to glycosylation promoting tumor invasiveness and treatment resistance [58, 59]. This finding is consistent with previous research indicating that glycosylation can impact the biological behavior of tumor cells and clinical outcomes in patients [60-62]. However, the identification, through large-scale data analysis, sets this study apart from specific Glycosylation genes negatively associated with prognosis. It provides new insights into the function of Glycosylation genes and presents potential biomarkers for clinical practice.
This study reveals significant differences in T cell infiltration and immune checkpoint expression among GBM subtypes with varying glycosylation gene expression, suggesting their role in tumor immune modulation and immunotherapy response. These findings align with recent tumor microenvironment research but uniquely link glycosylation gene alterations to immune evasion, providing potential targets for novel immunotherapies. For the first time, this study systematically explores the roles of COLEC12, LY75, CLEC5A, GPC4, RENBP, SRGN, and FMOD in the GBM immune microenvironment. A prognostic model based on these genes, developed using high-throughput transcriptomic and bioinformatics analysis, demonstrated strong predictive performance in both training and validation cohorts. Functional validation in cell and animal models confirmed their roles in GBM cell viability and tumor growth.
Integrating glycosylation gene expression with immune features enables personalized treatment strategies. Prognostic models based on these genes could assist clinicians in assessing patient outcomes and tailoring therapy. For high-risk patients, a combination of immune checkpoint inhibitors and targeted therapies may improve efficacy. Additionally, drug sensitivity analysis could further refine treatment selection, enhancing therapeutic response while minimizing side effects and improving patient quality of life.
This study used CIBERSORT and oncoPredict tools to assess the relationship between Glycosylation gene expression and drug sensitivity in GBM patients. The results indicated that high expression of certain Glycosylation genes is associated with reduced sensitivity to specific anticancer drugs. This finding provides a basis for personalized medicine and suggests a new direction for drug development. Furthermore, compared to previous research, this study innovated statistically and methodologically by employing new bioinformatic tools and algorithms, enhancing the reliability and precision of the results.
Through Lasso regression analysis, this study established a GBM prognosis model based on Glycosylation genes. Following rigorous data screening and preprocessing, this model, constructed using clinical and molecular data, demonstrated high predictive accuracy in the training set and exhibited robust performance in an independent validation set, confirming its reliability and displaying excellent predictive capabilities. These results suggest its effectiveness as a valuable tool for clinical prognosis assessment. Compared to previous studies, this study's model shows innovation and advancement in statistical methods and validation procedures, utilizing cross-validation and other modern statistical techniques to enhance the model's generalizability, aligning more closely with clinical application requirements. Moreover, applying this model aids in precise stratification of treatment strategies, potentially improving the efficacy of personalized treatment and patient survival rates.
This study implemented several methodological innovations, such as employing advanced chip technologies and integrating multiple bioinformatics tools for data analysis and interpretation. Applying these techniques and methods enhanced the research's efficiency and accuracy and increased the generalizability and applicability of the results. Particularly notable is the unique advantage of these methods in handling large-scale gene expression data. The utilization of state-of-the-art chip technologies facilitated more precise determination of Glycosylation gene expression levels, while the effective use of bioinformatics tools like R software packages and Python scripts streamlined the processing of large datasets, extracting meaningful biomarkers and enhancing the credibility and validity of the research findings. Furthermore, by integrating diverse data analysis tools, this study not only deepened data interpretation but also broadened the scope of analysis, providing additional biological insights and establishing a strong foundation for future clinical applications.
While this study provides new insights into glycosylation genes in GBM, several limitations exist. First, the relatively small sample size may limit the statistical robustness, and all data were sourced from public databases, lacking transparency in sample collection and processing, potentially introducing bias. Second, although the model was validated in both training and validation sets, independent multi-center validation is lacking, limiting generalizability. Third, while various bioinformatics tools were used, each carries inherent limitations, affecting interpretability. Finally, this study focused on gene expression but did not explore protein-level changes or their direct links to clinical features, restricting insights into molecular mechanisms. Although cell and animal models validated some genes, these experiments primarily assessed cell viability, clonogenic ability, and invasion/migration, without investigating specific signaling pathways or protein interactions, which warrants further study.
Future research should address these limitations and expand the clinical application of glycosylation genes in GBM treatment. Large-scale, multi-center validation is needed to enhance reliability. Future studies should also bridge gene expression to protein function, using proteomics to elucidate how glycosylation impacts tumor behavior and prognosis. Additionally, combining glycosylation genes with other biomarkers may improve GBM classification and prognosis assessment. Lastly, with advances in precision medicine, exploring how glycosylation-related findings translate into targeted and immunotherapy strategies will be crucial. These efforts may lead to more effective and personalized GBM treatments.
5 Conclusion
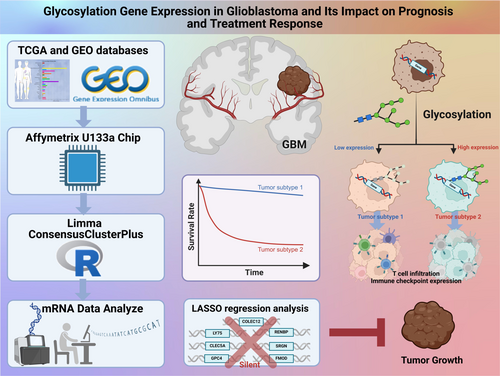
This study has identified that the expression heterogeneity of Glycosylation-related genes in GBM can be utilized to differentiate tumor subtypes, which exhibit notable survival disparities. High expression of Glycosylation genes is associated with poorer prognosis, and these genes' expression patterns are also linked to the activity of the immune microenvironment and drug sensitivity, mainly correlating with differences in immune checkpoint expression and immune cell infiltration levels. Leveraging these findings, a glioma prognosis model based on key Glycosylation-related signature genes was successfully developed, with validation in clinical samples demonstrating strong predictive performance (Figure 11).
Author Contributions
T.Z., H.G., and C.L. contributed equally to this work. T.Z., H.G., and C.L. performed the data analysis and interpreted the results. J.C. and X.W. conceptualized the study, supervised the research, and provided critical revisions to the manuscript. All authors read and approved the final manuscript.
Acknowledgments
The authors have nothing to report.
Disclosure
Ethical Declaration: This study adhered to ethical guidelines for human and animal research, following the latest Helsinki Declaration and international ethical standards. Approval was obtained from the relevant institutional ethics committee, and all patients provided informed consent. Animal experiments complied with the International Guiding Principles for Biomedical Research Involving Animals and were approved by the Institutional Animal Care and Use Committee (IACUC). Measures were taken to minimize animal pain and reduce animal use to the necessary minimum. All procedures were performed by trained personnel under appropriate anesthesia and analgesia, ensuring humane euthanasia post-experiment. This study was conducted with scientific rigor and ethical compliance to ensure data reliability.
Ethics Statement
All animal experiments were approved by the Animal Ethics Committee of the First Affiliated Hospital, Fujian Medical University.
Conflicts of Interest
The authors declare no conflicts of interest.
Open Research
Data Availability Statement
This study includes (1) public mRNA and clinical data from TCGA (https://portal.gdc.cancer.gov/) and GEO (https://www.ncbi.nlm.nih.gov/gds/); and (2) experimental data from cell assays and in vivo glioma models, available from the corresponding author upon request.


