Pilomotor seizures marked by infraslow activity and acetazolamide responsiveness
Abstract
A patient with pilomotor seizures post anti-LGI1 limbic encephalitis, refractory to immunotherapy and anti-epileptic drugs, was investigated with electroencephalography and magnetoencephalography. Seizures occurred daily (14.9 ± 4.9/day), with catamenial exacerbation, inducible by hyperventilation. Anterior temporal ictal onsets were heralded (by ~15 sec) by high amplitude ipsilateral electromagnetic infraslow activity. The catamenial/ventilatory sensitivity and the infraslow activity (reflecting glial depolarization) suggested an ionic, CO2/pH-related glioneuronal mechanism. Furosemide decreased seizure frequency by ~33%. Acetazolamide led to immediate seizure freedom, but lost efficacy with daily treatment. A cycling acetazolamide regimen (2 days on, 4 days off) plus low-dose topiramate maintained >95% reduction (0.5 ± 0.9/day) in seizures.
Introduction
Patients with voltage-gated potassium channel complex limbic encephalitis attributable to leucine-rich glioma-inactivated 1 (LGI1) auto-antibodies – anti-LGI1 encephalitis (ALGI1E) – frequently present with pathognomonic lateralized motor spasms known as faciobrachial dystonic or tonic-dystonic seizures,1-3 characterized in electroencephalography (EEG) recordings by an electrodecremental pattern and a contralateral frontal lobe “DC shift”, or infraslow activity (ISA).1, 4 Temporal lobe seizures also occur in ALGI1E patients,1, 3-6 often subclinical and with atypical EEG features, including sensitivity to hyperventilation.1, 4, 5 In patients with clinical temporal lobe seizures a pilomotor semiology is common, which has been described to reflect mesial temporal, and possibly insular, ictal activity.3, 6-9
We describe a patient post-ALGI1E with medically refractory pilomotor seizures sensitive to hyperventilation and menstruation. Seizures were heralded by conspicuous lateralized ISA, recorded with EEG and magnetoencephalography (MEG). MEG showed an ipsilateral magnetodecremental pattern during the ISA, beginning ~15 sec before the appearance of rhythmic ictal activity over the ipsilateral temporal lobe. Seizures were singularly responsive to a cycling regimen of acetazolamide drug therapy. The clinical, neurophysiologic, and pharmacologic features suggested a glioneuronal mechanism of seizure generation, and a specific, mechanistically guided treatment.
Subject and Methods
Case history
A 35-year-old woman was referred for video-EEG investigation of daily episodes of “chills,” associated with goosebumps, diaphoresis, and pallor. Episodes lasted ~15 sec, with no alteration of consciousness. Piloerection affected both arms, right>left. The patient tracked event occurrences (mean 14.9 ± 4.9/day) by smartphone screen capture of date and time. She noted a marked catamenial exacerbation. Episodes were refractory to carbamazepine, valproate, levetiracetam, and clobazam.
Eighteen months earlier, the patient began to experience memory difficulties and episodic diaphoresis, ultimately presenting to hospital with hyponatremia and a generalized tonic-clonic seizure. Brain MRI showed bilateral mesial temporal FLAIR hyperintensities and LGI1 antibodies were identified in serum. Other investigations were normal. There were no motor spasms. She was treated with intravenous immunoglobulin (IVIG) and methylprednisolone followed by oral prednisone, plasmapheresis ~2 months after IVIG, and then rituximab. Prednisone was tapered to discontinuation after 7 months. IVIG was administered a few months later because of ongoing episodes. Repeat serum and CSF analyses were negative for LGI1 antibodies 8, 12, and 18 months after onset of symptoms. Repeated MRI scans showed stable diminution of the initial mesial temporal hyperintensities.
EEG and MEG recordings
Continuous 32-channel video-EEG was obtained using Natus/Xltek (Oakville, Canada) EMU40 amplifiers, sampling frequency 256 Hz, analog bandwidth 0.07–100 Hz, input impedance >100 mΩ. Simultaneous MEG/EEG was acquired using an Elekta Neuromag TRIUX system (Helsinki, Finland), sampling frequency 1000 Hz, analog bandwith 0.03-330 Hz, tSSS artifact suppression (500-sec time window). Offline analyses and digital filtering used Insight (Persyst, Prescott, USA) and Curry 6 (Compumedics, Abbotsford, Australia).
Ictal MEG beamformer source reconstruction
Ictal source reconstruction applied dynamic imaging of coherent sources (DICS) frequency domain beamforming,10 implemented in FieldTrip.11 Ictal events were epoched into n trials of 1-sec duration; n = seizure duration in seconds. Randomly selected interictal periods of the same duration were similarly epoched (n = 500). Spectral comparisons of ictal versus interictal sets were plotted as average power over all channels and topographic power over sensor space for each frequency. The frequency of largest difference between the two sets was chosen for DICS computation. Both sets were pooled together to obtain a common beamformer filter. This filter was then applied independently to each set of trials, the end result displayed as the relative difference in power between ictal and interictal periods.
Results
EEG recordings
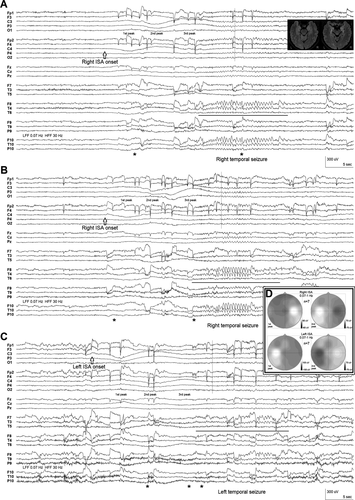
Ninety-four seizures were recorded during 6 days of video-EEG monitoring. The patient activated the event marker with every seizure, including seizures arising from sleep, and each subjective event was associated with a right or left temporal seizure lasting 15–25 sec, appearing as rhythmic 2–5 Hz activity maximal at F8/F10 > T4/T10 on the right and F7/F9 > T3/T9 on the left. Right-sided seizures were ~3 times more common. The sensation of the seizures was perceived as identical by the patient, irrespective the EEG lateralization.
Hyperventilation performed seven times induced electroclinical seizures (four left, three right) during 6 of the 3-min over-breathing epochs. Hyperventilation into a paper bag (repeated 3 times) had no activating effect.
The peri-ictal EEG segments were subsequently reviewed without the digital high-pass filter, and the rhythmic onset of each seizure was found to be heralded 15–20 sec earlier by a slow baseline shift recorded first ipsilaterally and then contralaterally to the eventual temporal seizure (Fig. 1). Prior to right temporal seizures this ISA occurred as a slow positivity peaking over the right centrotemporoparietal region, followed by a slow positivity peaking over the left central region, whereas left temporal seizures were preceded by similar ISA appearing first over the left centrotemporoparietal region. Analyzed with slow sweep speed in average referential montage, seizures could be easily identified and lateralized solely by the ISA visible in the broadband EEG recording. The ISA pattern was specific to seizure occurrences and could be appreciated in the standard clinical 0.5–70 Hz band-pass range, even in bipolar montages, but was much more evident after removal of the digital high-pass filter. Clinical onset tended to occur just after ISA onset, ~15 sec before the rhythmic ictal EEG pattern (Fig. 1), the latter presumably representing propagation from a mesial temporal or, possibly, insular site of seizure onset.7, 8

Interictally, rare right anterior temporal epileptiform discharges occurred during sleep on 2 days.
MEG recording and Ictal source reconstruction
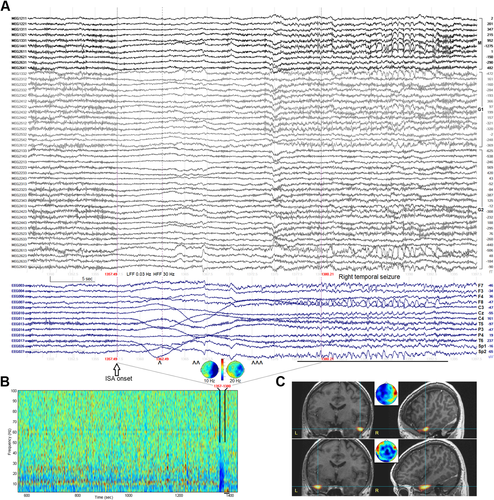
Three seizures (two right, one left) occurred during the 90-min MEG/EEG study. The ISA was more evident in EEG than MEG, but MEG showed to advantage a widespread ipsilateral amplitude decrement of cortical activity beginning at the time of ISA onset (Fig. 2A and B).

Figure 2C shows the localization results of the ictal events. Only the later, propagated rhythmic ictal periods could be modeled; no focal, earlier source of ictal activity during the ISA/magnetodecremental periods was identified. The ISA itself was unlocalizable, suggesting that the equivalent current dipole model, implicit in the forward model leadfield matrix, may not be applicable to ISA and its presumed glial/glioneuronal generation.12
Responsiveness to drug therapy
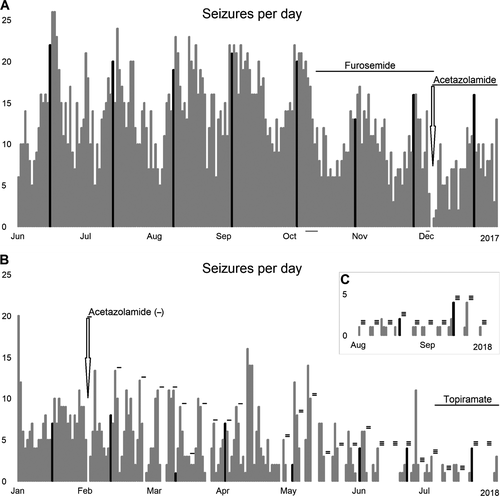
Given sensitivity to menses, hyperventilation and the ISA findings, a trial of furosemide 20 mg daily was initiated, with the rationale that ionic imbalances might underlie the putative glioneuronal/ISA seizure generating mechanism, and that inhibition of astrocytic Na+/K+/Cl− co-transporters (and modulation of cell swelling/extracellular space volume) might be beneficial.13, 14 A 52-day trial was associated with a significant, yet clinically suboptimal, decrease in seizure frequency to 10.1 ± 3.4/day (P < 0.0001, unpaired t-test, two-tailed; Fig. 3A).

Acetazolamide was then substituted for furosemide, with the rationale that its inhibitory effects on astrocytic carbonic anhydrase might more directly target a CO2/pH-sensitive mechanism.14, 15 After commencement of acetazolamide 125 mg bid the patient experienced her first seizure-free day in more than 6 months. The seizure-free period lasted 44 hours, before daily seizures recurred, albeit at a lower frequency (7.1 ± 3.7/day). Switching to alternate day dosing or 2 days on/2 days off was insufficient to regain seizure-freedom. Ultimately, a cycling regimen (2 days on/4 days off) was identified that produced seizure-free periods after each reintroduction of acetazolamide, lasting 41.4 ± 19.0 h at 125 mg bid, 72.3 ± 12.8 h at 250 mg bid, and 94.4 ± 39.0 h at 375 mg bid (Fig. 3B). Additional carbonic anhydrase inhibition with low-dose topiramate decreased seizures by >95% to 0.5 ± 0.9/day (P = 0.00000; Fig. 3B and C).
Discussion
The glycoprotein LGI1 forms part of a trans-synaptic bridge between presynaptic voltage-gated Kv1.1 potassium channels and postsynaptic AMPA receptors, but it is not known how LGI1 antibodies cause epilepsy, nor why so many features of extratemporal and temporal seizures in ALGI1E are distinct from other autoimmune or non-encephalitic epilepsies.2-6, 9, 16 Regarding neuronal hyperexcitability, LGI1 expressed at the axonal initial segment was recently demonstrated to regulate action potential firing by setting the density of axonal Kv1.1 channels that mediate dendrotoxin-sensitive D-type potassium currents.17 The generation of ISA is poorly understood, although given the slow time course glioneuronal mechanisms related to spreading depolarization/depression are important considerations and were hypothesized to underlie ISA preceding the motor spasms of ALGI1E.4 The electromagnetic ISA characterizing pilomotor seizures in this patient, combined with catamenial/ventilatory sensitivity and acetazolamide responsivity, further suggests glioneuronal interactivity in epileptogenesis post-ALGI1E.
Increased extracellular potassium related to sustained neuronal activity can lead to glial depolarization and ISA; moreover, signaling across the astrocytic syncytium can coordinate gliotransmitter release and reciprocally affect neuronal activity.4, 12, 18, 19 Separately, ISA induced by experimental CO2/pH manipulations has been interpreted to represent non-neuronal, non-glial potential differences across the endothelial blood–brain barrier.18
Although one cannot exclude an endothelial contribution, the ISA/magnetodecremental pattern presented here is consistent with glioneuronal generation, similar to that underlying ictal ISA/electrodecremental patterns.4, 12 Whether abnormal glial or neuronal activity initiates the process is unclear: sensitivity to menses and hyperventilation suggests glial initiation, but only indirectly. The location and polarity of the sequential ISA peaks are difficult to understand: the non-dipolar topographies are consistent with non-neuronal sources, but the peak maxima are perplexing, perhaps attributable to bihemispheric spatial buffering of potassium throughout the astroglial syncytium,19 although such an hypothesis is untestable at this time.
Acetazolamide increases sodium excretion and induces metabolic acidosis, but its main anti-epileptic effects are due to carbonic anhydrase inhibition, increasing neuronal [CO2] and decreasing glial pH and [HCO3−],14, 15 potentially modulating interglial gap junctional communication. Habituation with daily use is recognized,15 although the rapidity of habituation in this case was unexpected and awaits explanation.
The confluence of clinical, electromagnetic and pharmacologic features in this case is extraordinary. Our previous ALGI1E patients with hyperventilation-sensitive subclinical seizures5 did not show ictal ISA. However, another report of pilomotor seizures appears to show similar ISA before a left temporal seizure (see figure 3 in reference20), implying the phenomena described here are likely not unique to our patient.
Conflicts of Interest
None of the authors have any potential conflict of interest.
Author Contributions
Conception and study design (RW, LGD); data acquisition and analysis (RW, CM, PLC, LGD); manuscript and figure preparation (RW, LGD). All authors critically reviewed the manuscript and approved the final draft.


