Cortical alterations in phobic postural vertigo – a multimodal imaging approach
Abstract
Objective
Functional dizziness syndromes are among the most common diagnoses made in patients with chronic dizziness, but their underlying neural characteristics are largely unknown. The aim of this neuroimaging study was to analyze the disease-specific brain changes in patients with phobic postural vertigo (PPV).
Methods
We measured brain morphology, task response, and functional connectivity in 44 patients with PPV and 44 healthy controls.
Results
The analyses revealed a relative structural increase in regions of the prefrontal cortex and the associated thalamic projection zones as well as in the primary motor cortex. Morphological increases in the ventrolateral prefrontal cortex positively correlated with disease duration, whereas increases in dorsolateral, medial, and ventromedial prefrontal areas positively correlated with the Beck depression index. Visual motion stimulation caused an increased task-dependent activity in the subgenual anterior cingulum and a significantly longer duration of the motion aftereffect in the patients. Task-based functional connectivity analyses revealed aberrant involvement of interoceptive, fear generalization, and orbitofrontal networks.
Interpretation
Our findings agree with some of the typical characteristics of functional dizziness syndromes, for example, excessive self-awareness, anxious appraisal, and obsessive controlling of posture. This first evidence indicates that the disease-specific mechanisms underlying PPV are related to networks involved in mood regulation, fear generalization, interoception, and cognitive control. They do not seem to be the result of aberrant processing in cortical visual, visual motion, or vestibular regions.
Introduction
Functional dizziness syndromes are among the most common diagnoses in chronic vertigo patients.1 Recently, the Committee for Classification of Vestibular Disorders of the International Society for Neurootology – the Bárány Society – established a definition for functional dizziness syndromes for the disorder “persistent perceptual-postural dizziness” (PPPD)2, 3 based on clinical observations and data on phobic postural vertigo (PPV),4 chronic subjective dizziness (CSD),5 visual vertigo,6 and space and motion discomfort.7 As PPPD was not yet established at the beginning of this study, the patients included in our study were evaluated according to the initial diagnostic criteria of PPV.8, 9 PPV is defined by symptoms of subjective postural imbalance and dizziness, but objectively normal neuro-otological test results, often accompanied by obsessive-compulsive personality traits, anxious and depressive symptoms. Later posture and gait analyses disclosed typical leg muscle co-activation during stance and gait indicating an anxious behavior.4, 9-11 PPV patients are constantly preoccupied with their balance, anxiously monitoring it.10-14 Precise posturographic analyses of stance showed that PPV patients increased their postural sway by co-contracting the flexor and extensor leg muscles during normal stance.10-12 During difficult balancing tasks, however, their posturographic data did not differ from those in healthy subjects.15 Furthermore, compared to other types of vertigo the prevalence of psychiatric disorders, typically depression or anxiety is increased in functional dizziness.16, 17 At the beginning, the dizziness in PPV occurs in attacks often induced by typical triggers of phobic syndromes (e.g., bridges, driving a car) or by a moving visual scene8, 9 before it comes to a generalization of dizziness. Consequently, patients show avoidance behavior and a tendency to generalize the provoking stimuli.18
Up to now very little is known about how these behavioral consequences are linked to cortical neural networks, especially the visual and vestibular networks during visual stimulation and the emotional network. In a functional magnetic resonance imaging (fMRI) study with sound-evoked vestibular stimulation CSD patients showed reduced activity and altered functional connectivity in vestibular, visual, and prefrontal cortical regions.19 These findings suggest that the persisting vestibular symptoms may be linked to aberrant activity and connectivity within the vestibular-visual-prefrontal network.
The current multimodal neuroimaging study analyzed brain morphology, activity, and connectivity in patients with PPV to pin-point disease-specific mechanisms, using voxel-based morphometry, functional magnetic resonance imaging, and functional connectivity analyses.
Methods
Participants
Forty-four patients with primary PPV (mean age 44 ± 14 years, 24 females, 42 right-handers) and 44 healthy controls (HC, mean age 43 ± 14, 24 females, 42 right-handers) participated in the study. All patients were recruited from the Department of Neurology and the German Center for Vertigo and Balance Disorders, Ludwig-Maximilians University, Munich, Germany, from January 2010 to December 2015. They underwent a detailed neurological and neuro-otological onsite assessment to exclude possible organic or other somatoform disorders. Vestibular testing of the vestibulo-ocular reflex included bilateral caloric irrigation (30/44°C) for the low-frequency range and a clinical head-impulse test20 for the high-frequency functions of the semicircular canals, as well as measurements of the subjective visual vertical and ocular torsion for otolith function.
The diagnosis of PPV was based on the following diagnostic criteria: subjective dizziness and/or posture and gait instability, but no pathological findings in neurological and neuro-otological tests, as acknowledged by the Bárány Society.3, 8 The HCs were individually age- and gender-matched to the patients and had no history of psychiatric, neurological, or neuro-otological disorders. Patients and HCs were not allowed to take any psychoactive medication, and should not have a cerebrovascular disorder. All subjects completed the German version of the Beck Depression Inventory, BDI.21 The study was approved by the local Ethics Committee of the Ludwig-Maximilians-University, Munich, Germany. All subjects gave their informed written consent to participate in the study.
Neuroimaging data acquisition
Structural and functional images were acquired on a clinical 3T scanner (GE, Signa Excite HD, Milwaukee, WI, USA) at the hospital of the Ludwig-Maximilians-University, Munich, using a 12-channel head coil. The functional images were recorded using a T2*-weighted gradient-echo echo-planar imaging sequence sensitive to blood oxygen level dependent (BOLD) contrast (repetition time TR = 2.45 sec, echo time TE=40 msec, flip angle FA=90°, voxel size 3 × 3 × 3 mm, 38 transversal slices). Each of the three consecutive functional runs contained 264 MRI volumes covering the whole brain. Four prior scans to allow for magnetization equilibrium by the scanner were discarded automatically. Slices were measured in an ascending interleaved order. The high-resolution structural T1-weighted image (slice thickness=0.7 mm, matrix 256 × 256, field of view 220 mm, phase encoding direction=anterior/posterior, FA=15 msec, bandwidth=31.25, voxel size: 0.86 × 0.86 × 0.7 mm) was acquired at the start of the MRI session.
Functional neuroimaging
Thirty-four patients (mean age 40 ± 13, 16 females, 32 right-handers) and 37 HCs (mean age 43 ± 26, 18 females, 34 right-handers) participated in the functional neuroimaging experiment.
The subjects were equipped with a Lumina LU400-Pair button response unit (http://cedrus.com/lumina/), earplugs, and sound-isolating headphones. A laptop running MATLAB 8.0 (The MathWorks, Inc., Natick, Massachusetts, US) and the cogent 2000 toolbox (http://www.vislab.ucl.ac.uk/cogent_2000.php) delivered the stimuli. The field of view was restricted to ±24.9° in the horizontal and ±18.9° in the vertical plane.
The stimulation paradigm consisted of subsequent periods of stationary and moving patterns, intended to trigger the visual motion aftereffect (MAE), that is, the illusion that occurs after being exposed to a moving directional stimulus for a prolonged time.22 The experiment, modeled in a block-design, comprised three runs (3 × 11 min), each including 12 blocks of moving stimulation (7°/sec), followed by a stationary period of 27.5 sec each. The stimuli consisted of 600 black and white dots (diameter = 0.5°) randomly positioned on a gray background. The subjects were instructed to indicate the end of the experienced MAE using the response unit during the stationary period.
Data analysis
Behavioral data
The behavioral data were analyzed in SPSS 22.0 (SPSS Inc., Chicago, Illinois, US). After testing for normality, two-sample t-tests were applied to compare the means of the latencies of the MAE in the different conditions between the two groups. P values below a value of 0.05 were considered significant.
Voxel- and surfaced-based morphometry (VBM/SBM)
The CAT12 toolbox Version 1109 (http://dbm.neuro.uni-jena.de/cat/) was used to perform voxel-based morphometry and surface-based cortical thickness analysis. The T1-weighted image was DARTEL-normalized23 to MNI space, segmented into gray matter, white matter, and cerebrospinal fluid and smoothed with an 8-mm FWHM Gaussian kernel filter. Surface reconstructions of cortical thickness values for each hemisphere were resampled and then smoothed with a 15-mm filter.24 The modulated normalized volume images were combined in a whole-brain voxelwise statistical analysis (two-sample t-test) in the VBM approach and age and total intracranial volume (TIV) were entered as nuisance regressors in each comparison. An association was tested for BDI score and duration of disease and voxelwise gray matter density information in two separate random-effects multiple regression analyses. Activation maps were thresholded at P < 0.001 (uncorrected) for cluster definition and considered significant at P < 0.05 (FDR corrected) at a cluster level with a minimum cluster size of 10 voxels.25 The resulting regions were visualized and identified with the anatomy toolbox in SPM12.26
Task-based fMRI data analysis
Data processing was performed with MATLAB using SPM12 (http://www.fil.ion.ucl.ac.uk/spm/software/spm12/). Prior to preprocessing the motion fingerprint algorithm27 was used to detect head motion larger than 3 mm or 3° in any axis or direction within one session with respect to the first image.
The functional images were slice-time corrected and realigned to the mean image of the respective run. The structural image was coregistered to the mean functional image, followed by segmentation into gray and white matter and DARTEL registration. Subsequently, the functional images were normalized with the DARTEL-derived flow fields23 using a publicly available template (http://brain-development.org/ixi-dataset/) and spatially smoothed with a 6-mm Gaussian kernel filter.
A general linear model (GLM) assessed the effects of the task parameters on the BOLD activation for each subject using SPM 12. First-level GLMs included the experimental conditions Motion and Aftermotion, convolved with the canonical hemodynamic response function (HRF). Motion was modeled as of fixed duration, whereas the Aftermotion duration was defined by inserting the individually recorded duration of the MAE in the design matrix. The previously acquired realignment parameters were included as additional regressors of no interest. Low frequency signal drift was eliminated using a standard high-pass filter (cut-off, 128s). The contrasts Motion and Aftermotion were defined to compute contrast images.
The contrast images from the first-level analysis were used to employ a random-effects model to examine group differences. Two-sample t-tests between healthy subjects and patients as well as linear correlation analyses with behavioral data were performed. Activation maps were thresholded at P < 0.001 (uncorrected) for cluster definition and considered significant at P < 0.05 (FDR corrected) at a cluster level with a minimum cluster size of 10 voxels.25 The resulting regions were visualized and identified with the anatomy toolbox (Version 2.2c) in SPM12.26
Task-based functional connectivity
Functional connectivity was analyzed using the DPARSFA 4.1 (http://rfmri.org/dpabi) toolkit implemented in SPM 12, using the first run of the functional images. Data were slice-time corrected and realigned for head motion correction. The corrected images were DARTEL-normalized to MNI space,23 resampled to 2 × 2 × 2 mm³ and spatially smoothed with a 6-mm FWHM Gaussian kernel filter. Nuisance covariates, including cerebrospinal fluid and white matter signals, were regressed out of the BOLD signals, and band-pass filtering (0.01–0.1 Hz) was applied to reduce noise derived from physiological signals. Based on the results obtained in the VBM analysis and fMRI experiment, regions of interest (ROIs) were defined as follows: frontopolar area (fpPFC), orbitofrontal cortex (OFC), and subgenual anterior cingulate cortex (sACC). Activity within the anatomically defined ROIs was extracted and correlated with all other gray matter voxels in the brain. The obtained correlation coefficients were then transformed to Fisher z-scores. To identify differences in the connectivity of the ROIs between patients and controls, a two-sample t-test was carried out. A threshold P = 0.05 was set after FDR correction, with a critical cluster size of 50.
Results
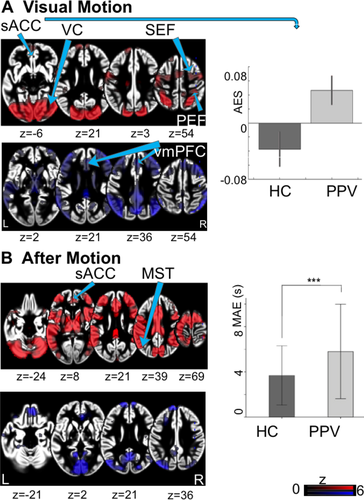
The mean BDI score of the patients was 9.3 ± 6.3 SD and 0.9 ± 1.1 SD in controls. Across all runs, the patients had significantly longer (P < 0.0001) experiences of the MAE as the HCs (Table 1, Fig. 1).
| Characteristics | PPV | HC |
|---|---|---|
| Participants (total) | 44 | 44 |
| Age (SD) in years | 44 (14) | 43 (14) |
| Gender | 24 females | 24 females |
| Handedness | 42 right-handed | 42 right-handed |
| BDI (SD) | 9.3 (6.3) | 0.9 (1.1) |
| Duration of disease (SD) in months | 33 (37) | – |
| Participants fMRI experiment | 34 | 37 |
| Age (SD) in years | 40 (13) | 43 (26) |
| Gender | 16 females | 18 females |
| Handedness | 32 right-handed | 34 right-handed |
| MAE (SD) in seconds | 5.70 (1.71) | 3.68 (1.17) |
- SD, standard deviation; BDI, Beck Depression Inventory; MAE, motion aftereffect.
Voxel-based morphometry
Poor data quality as a result of hardware instabilities of the scanner (spiking) during image acquisition led to the exclusion of seven patients from the study. Therefore, 37 patients and 37 HCs participated in the final VBM/SBM data analyses.
Patients showed increased gray matter volumes (GMV) in the thalamus bilaterally, more specifically, the prefrontal projection zone of the thalamus,28 precentral gyrus, and primary motor cortical areas and reductions in left supramarginal gyrus (SMG), bilateral cerebellar lobules, and right posterior middle frontal gyrus (Table 2, Fig. 2).
| Brain Region | Hemisphere | Peak T value | Voxels | MNI coordinates | Brodmann area | ||
|---|---|---|---|---|---|---|---|
| x | y | z | |||||
| PPV>HC | |||||||
| Thalamus | r | 8.10 | 5157 | 3 | −21 | 10 | |
| Thalamus | l | 7.48 | 3862 | −17 | −32 | 8 | |
| Paracentral lobule | l | 3.83 | 171 | −10 | −30 | 78 | BA4 |
| Precentral gyrus | l | 3.41 | 59 | −37 | −27 | 69 | BA4 |
| Postcentral gyrus | l | 3.44 | 23 | −21 | −40 | 73 | BA3 |
| PPV<HC | |||||||
| Supramarginal gyrus | l | 4.00 | 765 | −49 | −36 | 31 | BA40 |
| Cerebellum, lobule VIIa Crus II | r | 3.40 | 81 | 11 | −87 | −29 | |
| Cerebellum, lobule VIIa Crus I | l | 3.41 | 72 | −52 | −62 | −21 | |
| Posterior MFG | r | 3.33 | 36 | 12 | −5 | 52 | BA6 |
| BDI positive correlation | |||||||
| Precentral gyrus | r | 6.34 | 1570 | 6 | −25 | 59 | BA4 |
| mPFC | r | 5.09 | 430 | 5 | 64 | −8 | BA10 |
| Paracentral lobule | r | 4.83 | 405 | 10 | −28 | 80 | BA4 |
| dlPFC | r | 4.26 | 74 | 27 | 36 | 28 | |
| dlPFC | l | 4.19 | 41 | −35 | 35 | 43 | |
| vmPFC/OFC | l | 3.83 | 163 | −38 | 50 | −17 | |
| Precentral gyrus | l | 3.78 | 149 | −36 | −21 | 69 | BA4 |
| vmPFC | r | 3.76 | 10 | 12 | 31 | −11 | BA11 |
| Superior occipital gyrus | r | 3.74 | 18 | 28 | −72 | 40 | |
| Postcentral gyrus | r | 3.70 | 173 | 46 | −32 | 61 | BA1 |
| BDI negative correlation | |||||||
| Cerebellum, lobule VI | r | 4.89 | 326 | 29 | −48 | −37 | |
| Thalamus | l | 4.74 | 239 | −13 | −15 | 0 | |
| Middle occipital gyrus | r | 4.55 | 346 | 51 | −76 | 7 | |
| Cerebellum, lobule IX | l | 4.18 | 158 | −12 | −47 | −45 | |
| Disease duration positive correlation | |||||||
| vlPFC | l | 4.30 | 501 | −55 | 34 | 3 | BA45 |
| vlPFC | r | 3.77 | 18 | 52 | −2 | 19 | BA44 |
| Disease duration negative correlation | |||||||
| Postcentral gyrus | r | 4.41 | 539 | 63 | −20 | 36 | BA1 |
| Postcentral gyrus | l | 4.05 | 132 | −46 | −23 | 43 | BA3 |
| Supramarginal gyrus | r | 3.94 | 284 | 50 | −47 | 50 | |
| Superior frontal gyrus | r | 3.88 | 72 | 10 | 37 | 57 | |
| Cerebellum, dentate gyrus | r | 3.84 | 357 | 14 | −65 | −33 | |
| Cerebellum, vermis | r | 3.77 | 83 | 3 | −55 | −28 | |
- DlPFC, dorsolateral prefrontal cortex; l, left; MFG, medial frontal gyrus; mPFC, medial prefrontal cortex; OFC, orbitofrontal cortex; r, right; vlPFC, ventrolateral prefrontal cortex; vmPFC, ventromedial prefrontal cortex.
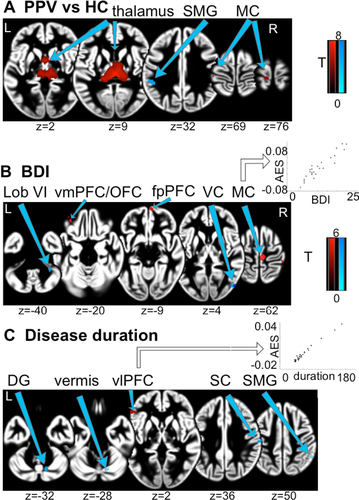
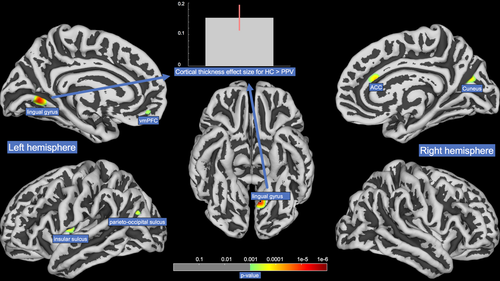
The duration since disease onset was associated with increased GMV in the ventrolateral prefrontal cortex (vlPFC) bilaterally. A negative correlation was found in postcentral gyrus bilaterally, cerebellar vermis, and right SMG. Relatively higher BDI scores were associated with increased GMV in frontopolar PFC (fpPFC), orbitofrontal cortex (OFC), dorsolateral PFC (dlPFC), medial PFC (mPFC) as well as bilateral pre- and right postcentral gyrus and with decreased GMV in right middle occipital gyrus, bilateral cerebellar lobules, and left thalamus. SBM analysis revealed greater values for cortical thickness in HCs for ventromedial prefrontal cortex, the insular sulcus and the lingual gyrus in the left hemisphere and a region bordering the anterior cingulate gyrus and the cuneus in the right hemisphere (Fig. 3).
Functional MRI
To be included in the functional neuroimaging analysis, subjects had to complete at least two runs. The main reason for data exclusion was premature termination of the task-experiment by the subject (overanxiousness). Consequently, 19 patients and 19 matched HCs were included in the final fMRI analysis.
Task-based fMRI
During the visual motion experiment, the response revealed a typical bilateral activation–deactivation pattern in visual and vestibular cortical areas (Fig. 1).29 Compared to HCs, patients showed increased activations in the subgenual anterior cingulate cortex (sACC). No significant deactivations were found in patients or HCs (Table 3).
| Brain Region | Hemisphere | Peak T value | Voxels | MNI coordinates | Cytoarchitectonic area | ||
|---|---|---|---|---|---|---|---|
| x | y | z | |||||
| Visual motion PPV>HC | |||||||
| Mid orbital gyrus | l | 4.52 | 21 | −4 | 26 | −6 | s24 |
| Visual motion PPV<HC | |||||||
| None | – | – | – | – | – | – | – |
| After motion PPV<HC | |||||||
| Mid orbital gyrus | l | 3.77 | 15 | −4 | 32 | −8 | s32 |
| After motion PPV<HC | |||||||
| None | – | – | – | – | – | – | – |
- l, left.
Task-based functional connectivity
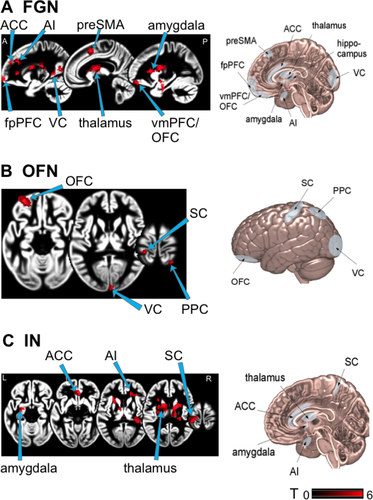
Patients showed higher functional connectivity than HCs between fpPFC and thalamus, anterior insular, parahippocampal gyrus, ACC, amygdala, and posterior medial frontal gyrus (Table S1, Fig. 4). Furthermore, patients showed lower functional connectivity of the fpPFC with posterior cerebellar lobules, SMG, and middle temporal gyrus areas. In patients the connections were increased between OFC and precentral gyrus, calcarine fissure and superior parietal lobule. Functional connectivity in patients compared to HCs was decreased between OFC and inferior frontal gyrus, cerebellar vermis, and posterior lobules. Stronger connectivity was seen in patients between sACC and left inferior frontal gyrus, fpPFC, lingual gyrus, postcentral gyrus, thalamus, and cerebellar lobule. There was no decreased connectivity with the sACC.
Discussion
In this multimodal imaging study, we analyzed morphological changes and task-based functional activity and connectivity of cortical networks in patients with chronic functional dizziness, in particular the subtype PPV. We found that the PPV patients had an increase in structural parameters and functional connectivity in regions of the prefrontal cortex and the associated thalamic projection zones bilaterally, as well as in the primary motor cortex compared to controls. Furthermore, analyses in the patients revealed a decrease in gray matter volume and connectivity in cerebellar regions including the cerebellar vermis and the posterior lobules as well as the supramarginal gyrus. Gray matter volume increases in various prefrontal areas correlated positively with the disease duration and the depression index. These task-based functional activity and connectivity analyses disclosed an aberrant involvement of networks known to be involved in regulating mood, emotion, and interoception as well as motor control. Much to our surprise no significant effects were found in the primary visual and vestibular cortical areas.
Prefrontal cortex and thalamus
PPV patients demonstrated a significant gray matter increase in the “higher-order” thalamus, which projects to the prefrontal cortex28 and plays a vital role in mood-regulating circuits and enables fast responses to threats.30 Complementary, task-based functional connectivity analyses revealed a hyperconnectivity between the mPFC, sACC, and the mediodorsal thalamus. Indeed, recent studies reported increased thalamo-cortical connectivity in various mood disorders during phobic-related threat stimulation.31 As PPV patients are particularly sensitive to certain sensory stimuli or social situations3, 8 and exhibit a constantly anxious appraisal behavior,10, 11, 15 possibly their networks regulating fear responses and emotion might be altered.
Individual disease duration in the patients correlated with volume increase in the vlPFC bilaterally, which is particularly relevant in the cognitive control of motor inhibition and facilitates the capacity to sustain attention.32, 33 PPV patients seem to extensively use these processes, as they are typically constantly occupied with controlling their posture and engaged in intense rumination.10-12, 14, 34 Thus, over time the recruitment of additional resources to avoid phobic responses could manifest as a structural volume increase in vlPFC.
Mood disorders are a common comorbidity in PPV12 and CSD.5 A positive correlation was observed between BDI and GMV in several prefrontal areas in our patients. A mutual characteristic of depression and PPV is an increased self-focus and excessive self-referential appraisal, mainly regulated by mPFC.35 The dlPFC is generally associated with attentional top-down control suppression of fear-induced behavior and part of the cognitive control network.36 Increased GMV in mPFC in more depressive PPV patients might reflect the excessive self-focus and appraisal,37 whereas an increase in dlPFC may be the result of cognitive control of immoderate fear response31 to the expected postural threat.
Affective, interoceptive, and orbitofrontal networks
During the visual motion stimulation experiment patients showed significantly increased activation in the sACC, a region involved in emotional processing38 commonly found to be inactive during visual motion stimulation in healthy subjects.29 For comparison, CSD patients showed decreased activity in the postero-insular vestibular cortex, hippocampus, and ACC and a disruption of the vestibular-visual-anxiety network when stimulated with loud, short tone bursts to evoke a vestibular-acoustic response.19 These results during stimulation differ from our findings; however, the stimulation paradigm and targeted sensory modality were not visual but auditory-vestibular. Our findings (during visual stimulation) suggest that the pathophysiology of PPV includes some deficits in fear regulation as the visual stimuli lead to the activation of pathways related to fear. The interaction of emotional disorders and vestibular symptoms has been comprehensively discussed in the literature39,40. Although not all PPV patients qualify as having psychiatric disorders, most develop an avoidance behavior.8 Moreover, an introverted, dependent, and anxious personality is a potential risk factor for the development and negative course of PPV.41 Patients with a personality of high resilience and optimism are less likely to develop persistent dizziness after an acute vestibular disorder,42 whereas personality traits such as neuroticism and introversion influence brain responses to vestibular and visual stimuli on visual-vestibular-anxiety systems.43, 44 We found task-dependent hyperconnectivities within brain networks regulating various aspects of emotional behavior and interoceptive pathways in PPV patients (Fig. 4), known to have similarly altered connectivities in patients with mood disorders45, 46: the fear-generalization network,47 the interoceptive network,48 and the orbitofrontal network.49 The enhanced connectivity within these networks might explain PPV patients’ over-generalization and phobic response to certain stimuli or situations, a disturbed self-awareness, and an increased compensatory mechanism for evaluating the specificity of potentially phobic stimuli, respectively.
The networks, which are in healthy controls typically highly connected during visual motion processing, including the precuneus, SMG and MT/V5,50 appeared to be less connected in PPV patients during our experiment. From posturographic studies and gait analyses it is known that PPV patients exceedingly rely on visual input during standing51 and walking.10 Patients with visually induced dizziness, also known as visual vertigo, also show an increased connectivity between thalamus, occipital cortex, and cerebellar areas.52 Furthermore, during a self-motion simulation in PPPD patients higher dizziness handicap values correlated positively with occipital activity.53 Thus, it seems possible that PPV patients shift their attentional focus toward mere visual information and as a consequence attenuate secondary visual integrating networks. This might result in the high sensitivity to visual stimuli, which is underpinned by the significantly longer duration of the MAE.
Motor cortex/Cerebellum
We found structural increases in the leg area of the primary motor cortex,54 which moreover correlated positively with the depression index and functional hyperconnectivity between motor and prefrontal cortex. These findings are complemented by results from posturographic studies and gait analyses in PPV patients, for they show a typical abnormal strategy for postural control of stance and gait.10, 11 The constant co-contraction of the anti-gravity muscles during normal stance in PVV patients seems to be an expression of the irrational fear of imbalance,11 also observed in specific phobias.55 It seems likely that the increase in primary motor cortex structure and connectivity with prefrontal areas reflects the predominant cognitive control of stance and gait. On the other hand, the decreases in cerebellar vermis and bilateral cerebellar posterior lobes correlated positively with BDI and disease duration. The cerebellum is important for several aspects of sensorimotor integration such as automatic subconscious motor control.56 The enhanced use of the primary motor cortex in PPV patients renders the function of subconscious motor control of the cerebellum unnecessary.
Limitations
The limitation of our study is that the only psychiatric measure available was the BDI, as we found these strong similarities in alterations compared to mood disorders. Future studies should further elucidate the relation and influence of factors such as anxiety and depression on functional dizziness. It is also important to note, that a large number of patients were unable to perform the longer lasting visual stimulation part of the study due to high anxiety. This could indicate that our cohort reflects a more “benign anxiety” patient subgroup.
Taken together, first evidence can be provided that patients with PPV, show an aberrant structure and function of networks and brain regions, known to be altered in mood disorders. On the basis of combined morphometric and functional data, we propose that the disease-specific underlying mechanisms in PPV lie within networks and areas involved in mood regulation, fear generalization, interoception, and cognitive control. Intriguingly, they were not a result of structural changes in primary visual or multisensory vestibular cortical areas. This raises the question whether PPV rather lies at the interface between functional and psychiatric disorders.
Acknowledgments
We thank Judy Benson, Ludwig-Maximilians-University, Munich, for copyediting the manuscript and Sabine Eßer, Ludwig-Maximilians-University, Munich, for copyediting the illustrations and all subjects for participating in the study. The work was supported by funds from the German Research Foundation (GRK Grant Code 1091), the German Federal Ministry of Education and Research (BMBF Grant Code 01 EO 0901) and German Foundation for Neurology.
Author Contributions
PP: acquisition and analysis of data, drafting of manuscript and figures. PzE: analysis of data, drafting of manuscript and figures. TS: design of the study, analysis of data. RB, RF, MH, PH: acquisition and analysis of data. MD: conception and design of study, drafting of manuscript.
Conflict of Interest
The authors report no conflicts of interest.


