In vivo detection of poststroke cerebral cell proliferation in rodents and humans
Abstract
Objective
F-18-fluorothymidine (FLT) is a positron emission tomography (PET) tracer for imaging cell proliferation in vivo. We aimed to assess FLT uptake as a marker for cerebral cell proliferation in a rat model of ischemic stroke and patients with cerebral infarct, correlating with disease severity and outcomes.
Methods
Cerebral FLT PET was performed in rats subjected to transient middle cerebral artery occlusion (MCAO) and patients with cerebral infarct. PET data were analyzed and expressed as average standardized uptake value ratios (SUVRs) using cerebellar cortex as reference. Infarct volume was analyzed by 2,3,5-triphenyltetrazolium chloride staining in rats and by magnetic resonance imaging in patients. Neurological function was assessed using modified Neurological Severity Score (mNSS) for rats and National Institutes of Health Stroke Scale (NIHSS) for patients.
Results
Seven days post-MCAO, rats' FLT PET displayed higher SUVRs in the infarcted brain, declining gradually until Day 28. FLT-binding ratio (SUVR in the infarcted brain divided by that in contralateral side) correlated positively with stroke severity (p < 0.001), and to early mNSS decline in rats with mild to moderate stroke severity (p = 0.031). In 13 patients with cerebral infarct, FLT PET showed high SUVR in the infarcted regions. FLT-binding ratio correlated positively with infarct volume (p = 0.006). Age-adjusted initial NIHSS (p = 0.035) and early NIHSS decline (p = 0.076) showed significance or a trend toward positive correlation with the FLT-binding ratio.
Interpretation
In vivo FLT PET detects poststroke cerebral cell proliferation, which is associated with stroke severity and/or outcomes in MCAO rats and patients with cerebral infarct.
Introduction
Stroke, one of the leading causes of mortality and disability globally,1 is mainly caused by an occluded cerebral artery, resulting in focal ischemia with irreversible injury. Cerebral cell proliferation predominantly occurs at the subventricular zone (SVZ), subgranular zone (SGZ), and rostral migratory stream in healthy brains without stroke.2, 3 In rodent models, studies have demonstrated the activation and proliferation of various cell types, including neural progenitor cells, microglia, astrocytes, and endothelial cells, within the infarcted regions following cerebral infarction.4-7 The activation and proliferation of various cell types after stroke may improve poststroke outcomes.8, 9 However, translating these findings to clinical practice and understanding their significance in stroke patients is complex and uncertain. Preliminary evidence has shown that stroke-induced neurogenesis may occur in the human brain,10 but the assessment of cerebral cell proliferation requires collecting brain samples via biopsy or autopsy for immunohistochemical evaluation, while noninvasive techniques to image cerebral cell proliferation are still limited, hampering our ability to monitor this process longitudinally and understand its dynamic nature in the clinical context. This knowledge gap underscores the need for a more comprehensive exploration of the clinical implications of neurogenesis after stroke in humans and the development of noninvasive methods to assess and track these processes in patients.
F-18-fluorothymidine (FLT) has been used as a positron emission tomography (PET) tracer to image cell proliferation in vivo.11 The tracer is phosphorylated by the enzyme thymidine kinase 1 (TK1), which is a principal enzyme in the DNA-salvage pathway in cells and is upregulated just before and during the S-phase.12 Because TK1 is primarily expressed in dividing cells, FLT uptake is limited to dividing cells, which makes FLT a reliable quantitative measure of cellular proliferation. As such, FLT uptake has been widely used in clinical oncology for the diagnosis and treatment monitoring of various tumors.11, 12 However, only a few studies have used this technique to detect cerebral cell proliferation in the poststroke rodent brain.13-15 Although FLT uptake does increase in the infarcted rodent brain, the features of such FLT uptake activity and their applicability in examining the poststroke human brain are still not fully understood.
In this study, we aimed to use the noninvasive neuroimaging technique to quantify the degree of cerebral cell proliferation in a rat model of stroke and in patients. We first assessed the changes in cerebral FLT uptake in a rat model of middle cerebral artery occlusion (MCAO) and analyzed the association between cerebral FLT uptake and the severity and outcomes of stroke. FLT uptake was then evaluated after administration of methylazoxymethanol acetate (MAM), a neuroblast inhibitor. Finally, we measured the cerebral FLT uptake in a group of patients with cerebral infarct to test its applicability.
Methods
Animal middle cerebral artery occlusion model
All animal experiments followed the protocols by the National Institutes of Health Animal Care and Use Committee and were approved by the Laboratory Animal Center at National Taiwan University College of Medicine (#20180146). The animal experiments for MCAO followed the protocols as previously described.16, 17 Briefly, male Sprague–Dawley rats (240–280 g) were anesthetized with a mixture of 20.8 mg/kg tiletamine HCl + zolezapam (Zoletil™, Virbac, Carros, France) and 8.3 mg/kg xylazine (Sigma-Aldrich, St. Louis, MO, USA). MCAO sutures (RWD Life Science, San Diego, CA, USA) was inserted from the right common carotid artery into the right internal carotid artery and then to the circle of Willis to occlude the origin of the right middle cerebral artery (MCA). One hour after MCAO, the nylon suture was removed for cerebral reperfusion.
18F-FLT imaging acquisition and data analysis of rats
18F-FLT was synthesized by nucleophilic substitution using benzoyl-protected anhydrothymidine according to the previously described method.18 PET was performed with an Argus microPET/CT scanner (SEDECAL, Madrid, Spain). Animals were anesthetized with 3.5% isoflurane, maintained with 1%–2% isoflurane in 65%/35% nitrous oxide/oxygen. After anesthesia, rats received an intravenous bolus injection of 18F-FLT (0.8–1 mCi/rat) into a tail vein and were placed in the scanner after 60 min of tracer injection. PET data were reconstructed in six time-frames (6fx300s) and were averaged for quantification of FLT-binding activity. By testing the integrity of blood–brain barrier (BBB) using the method of Evans blue extravasation,19 abnormal cerebral BBB integrity was found in the poststroke first week (Fig. S1). To avoid influence of FLT uptake by BBB damage, all PET studies were performed on or after poststroke 7 days.
Each PET image was realigned, resliced, and manually co-registered to a standardized T2-weighted MR template using the PMOD software. Regions of interest (ROI) on these spatially normalized images were defined using the Px Rat (W. Schiffer) atlas. The ROI included the striatum, frontal cortex, and temporal cortex. The cerebellar cortex was selected as the reference region. The PET data were analyzed semiquantitatively and expressed as standardized uptake value ratios (SUVRs) of ROI. The FLT-binding ratio was SUVR in the infarcted brain divided by that in the contralateral side.
Immunohistochemistry
Rats were anesthetized with a lethal dose of tiletamine HCl and zolezapam (Zoletil™, Verbac, Carros, France) and fixed by transcardial perfusion with saline, followed by 4% formaldehyde. The brains were removed and submerged in 30% sucrose. A series of 16-μm-thick sections were then cryo-cut and stored at −80°C. The brain sections were further incubated with anti-Ki-67 Antibody (Abcam, Cambridge, UK) for 2 h at 37°C. Samples were washed and incubated for 1.5 h at room temperature with the appropriate fluorescence-conjugated secondary antibodies as previously described.17 Samples were also counter stained with DAPI for detection of cell nucleus. These immunostained samples were then visualized by Carl Zeiss LSM880 (Carl Zeiss Microscopy, White Plains, NY, USA). We calculated the number of Ki-67 immunoreactive cells per low-power microscopic field (at least three fields in a randomized fashion) for each interest region to quantify the proliferating cellular density in brain sections.
Neuroblast inhibition with methylazoxymethanol acetate
Post-MCAO intraventricular methylazoxymethanol acetate (MAM) treatment (7 mg/kg) was achieved using an Alzet osmotic minipump (infusion at a speed of 1 μL/h for 7 days; Alzet, Palo Alto, CA). MAM is an antimitotic and proliferative compound toxin that targets neuroblast development.20 One day after MCAO, rats were anesthetized and placed in a stereotaxic apparatus with bregma and lambda in the same horizontal plane. A heating pad was used to maintain the body temperature at 37 ± 0.5°C. A midline skin incision was made and a stainless steel cannula (28 gauge) was implanted in the right lateral ventricle (reference to bregma: anteroposterior = −0.8 mm, lateral = −1.5 mm, depth = 3.5 mm) and connected to an osmotic mini-pump (model 2001, Alzet), which was placed subcutaneously on the back of the rat.
2,3,5-triphenyltetrazolium chloride (TTC) staining
After decapitation, the rat brain was removed quickly and sectioned into 2 mm thick slices using an adult rat brain slicer (Zivic Instruments, Pittsburgh, PA, USA) then immersed for 3 min into 2% TTC (Sigma-Aldrich, St. Louis, MO, USA) solution at 37°C. The infarction volume was determined in brain tissue that lacked TTC staining and quantified using Image J (National Institutes of Health, Bethesda, MD, USA). We calculated the percentage of infarcted volume using the formula: Infarcted volume (%) = {[the intact contralateral hemisphere volume − (the ipsilateral hemisphere volume − the infarcted volume)]/the intact contralateral hemisphere volume} × 100% as previously described.17
Behavioral testing
Modified Neurological Severity Score test (mNSS) was performed 1 day and 7 days after MCAO as previously described.16, 17 Briefly, the test contains a series of motor, sensory, reflex, and balance tests. In the severity scores of injuries, 1 score point is awarded for the inability to perform the test or for the lack of a tested reflex. Neurological function was graded on a scale of 0–18 (normal score, 0; maximal deficit score, 18). The higher the score, the more severe the injury.
Patients
Patients with infarcts in MCA territories were recruited from the National Taiwan University Hospital from November 2018 to July 2019. Based on preliminary animal data (SUVR difference between infarcted brain and contralateral side), with significance (alpha) set at two tailed 5% and power (1-beta) at 80%, sample size was calculated to be around 20. Patients who were not able to receive the MRI or PET studies for reasons such as poor cooperation, hemodynamic instability, or implantation of cardiac pacemaker, were excluded. Stroke severity was evaluated using the National Institutes of Health Stroke Scale (NIHSS) during the initial encounter and on Day 7 after the stroke event. For patient receiving thrombolytic therapy or endovascular thrombectomy, the initial NIHSS was defined as the NIHSS evaluated within 5 h after reperfusion treatment. The early NIHSS decline was defined as the initial NIHSS minus the NIHSS from Day 7. The procedures were approved by the Research Ethics Committee of the National Taiwan University Hospital (201804036MINB).
Image acquisition and data analysis of patients
All subjects underwent brain MRI with DWI and ADC for detection of infarcted areas. In addition, an FLT-PET/CT scan was performed to detect infarcted areas and to evaluate in vivo cerebral cell proliferation between poststroke Day 7 and Day 14. MRI was performed using either a 1.5T (Siemens Aera, Siemens Corp., Sacramento, CA, USA) or 3T (Siemens Verio, Siemens Corp., Sacramento, CA, USA) MRI scanner. In addition to DWI and ADC, other conventional imaging protocols included T1-weighted three-dimensional magnetization-prepared rapid gradient-echo anatomic imaging, and T1-weighted, T2-weighted, fluid-attenuated inversion recovery imaging, and time-of-flight angiography. Approximately 40 min after injection of 0.07 mCi/kg (maximum 5 mCi) FLT, static PET images (Discovery ST, GE Healthcare, Milwaukee, WI, USA) were acquired for 20 min, and the PET data were reconstructed with ordered set expectation maximization and corrected for attenuation.
Each MRI and FLT-PET/CT image was realigned, resliced, and semiautomatically co-registered to a standardized T1-weighted magnetic resonance template using PMOD software (PMOD Technologies, Zurich, Switzerland). Infarcted areas, which were defined by increased DWI and reduced ADC signals on MRI, were delineated manually on each MRI slice as ROIs, and finally summated using volume of interest (VOI) analysis after all infarcted areas had been included. Subventricular zone (SVZ), a known neurogenic region, was also identified on MRI for analysis,21 with areas involved by the infarct excluded manually. VOIs were calculated automatically and were then applied to the corresponding FLT-PET/CT images. The PET data were analyzed semi-quantitatively and expressed as SUVRs of VOIs with the cerebellar cortex selected as the reference region. In addition, the VOIs were mirrored in the sagittal plane to the contralateral hemisphere (non-infarcted hemisphere), which served as the non-infarcted control regions. The FLT-binding ratio was calculated as the average SUVR in the infarcted region divided by that in the mirrored contralateral side, and the FLT-binding ratio of SVZ was calculated in a similar fashion.
Statistical analysis
Categorical variables are presented as percentages and the continuous or discrete variables are presented as mean ± standard deviation or median with range. Statistical analysis comparing mean differences in paired samples was performed using Wilcoxon signed-rank test, and repeated measures ANOVA was employed for trend analysis. The correlation between SUVR and infarct volume, logarithm of infarct volume, mNSS, mNSS decline, age, initial NIHSS, and NIHSS decline were examined using Pearson correlation analysis. All statistical analyses were performed using SPSS version 19 (SPSS Inc., Chicago, IL, USA). All tests of significance were two-tailed with a threshold for significance of p < 0.05.
Results
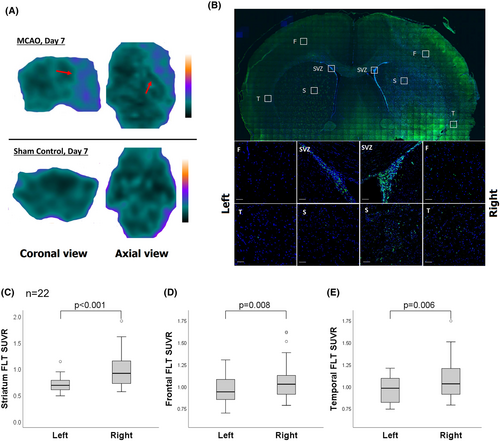
Cerebral FLT PET was acquired 7 days after MCAO (n = 22, mean initial mNSS = 10.4 ± 2.7). The FLT PET showed higher tracer uptake in the right hemisphere (infarcted side) (Fig. 1A). On immunohistochemistry, rats exhibited a high number of Ki67 immunoreactive cells at the subventricular zone, striatum, frontal cortex, and temporal cortex of the right hemisphere (Fig. 1B). On FLT-PET, the mean SUVR was higher in striatum (0.98 ± 0.34 vs. 0.71 ± 0.15, p < 0.001), frontal cortex (1.09 ± 0.26 vs. 0.96 ± 0.15, p = 0.008), and temporal cortex (1.10 ± 0.25 vs. 0.97 ± 0.15, p = 0.006) in the right hemisphere compared to the left side (Fig. 1C–E). The increased FLT-binding activity could be suppressed by the treatment with a neuroblast inhibitor MAM (Fig. S2).
Longitudinal follow-up of cerebral FLT PET was performed on post-MCAO Day 7, Day 14, and Day 28 (n = 4, all initial mNSS = 13). Results showed a gradual decline in cerebral tracer uptake (Fig. 2A). In the right hemisphere, the FLT-binding activity showed a significant decreasing trend from post-MCAO Day 7 to Day 28 in striatum (from 1.49 ± 0.36 to 0.79 ± 0.09, p = 0.014), frontal cortex (from 1.50 ± 0.14 to 1.05 ± 0.14, p = 0.036), and temporal cortex (from 1.43 ± 0.27 to 0.98 ± 0.11, p = 0.008) (Fig. 2B). The FLT SUVR showed no significant differences in post-MCAO between Day 7 and Day 28 in the left hemisphere. In the context of Ki67 immunohistochemistry, a distinct group of rats was utilized, which also exhibited a similar trend of higher numbers of Ki67 immunoreactive cells being observed in the infarcted brain on post-MCAO Day 7 and the number gradually decreased from Day 14 to Day 28 (Fig. S3).
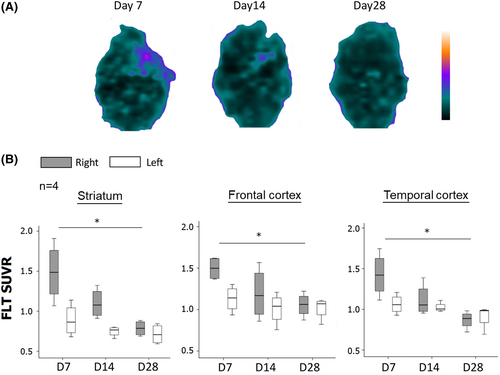
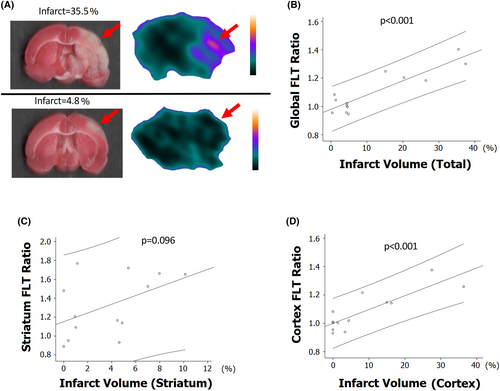
Figure 3A shows representative cerebral FLT PET and corresponding infarcted brain with TTC staining. For each rat, the FLT-binding ratio was defined as the average SUVR in the infarcted brain divided by that in the contralateral side. The global (cortex and striatum) FLT-binding ratio showed strong positive correlation with the whole infarct volume (Fig. 3B, p < 0.001, r = 0.90) and the cortex FLT-binding ratio showed positive correlation with the cortex infarct volume (Fig. 3D, p < 0.001, r = 0.85). However, no significant correlation was shown between the striatum FLT-binding ratio and striatum infarct volume (Fig. 3C, p = 0.096).
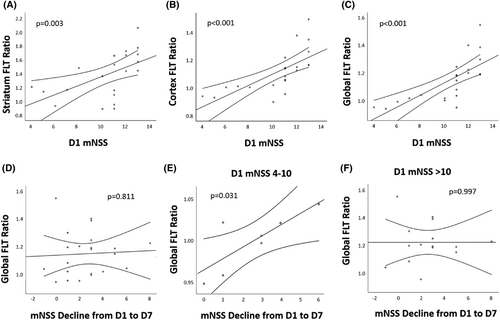
In addition, the initial mNSS showed positive association with the FLT-binding ratio in striatum, cortex, and global regions (p ≤ 0.005; Fig. 4A–C). Using mNSS decline (Day 1 mNSS minus Day 7 mNSS) to represent the degree of poststroke neurological improvement, the overall mNSS decline did not show significant correlation with the global FLT-binding ratio (Fig. 4D). Since the FLT SUVR correlated with the severity of MCAO, which was potentially associated with outcome, MCAO rats (n = 22, mean initial mNSS = 10.4 ± 2.7) were stratified into two groups according to the initial mNSS. In MCAO rats with initial mNSS ≤ 10, the higher global FLT-binding ratio was associated with the larger mNSS decline (Fig. 4E, p = 0.031, r = 0.799). However, in MCAO rats with initial mNSS > 10, the mNSS decline did not show significant correlation with the global FLT-binding ratio (Fig. 4F). A total of 15 patients with infarcts in the MCA territories received FLT-PET/CT imaging studies. Two patients were excluded; one due to significant hemorrhagic transformation, and the other due to marked delay (>14 days) in obtaining MRI. The remaining 13 patients (mean age 69.6 ± 10.3 years; male, 38%) were included for image analysis (Table S1), among whom 8 (61.5%) had infarcts in the left MCA territory. The mean initial NIHSS was 8.8 ± 5.4 and the mean NIHSS decline was 5.4 ± 4.4. The mean time of FLT-PET/CT acquisition was 10.2 ± 2.1 days. The mean infarct volume was 44.5 ± 47.7 cm3 (range 5–191 cm3), and the mean FLT SUVR in the infarcted regions was 2.53 ± 1.11 (range 0.67–4.81).
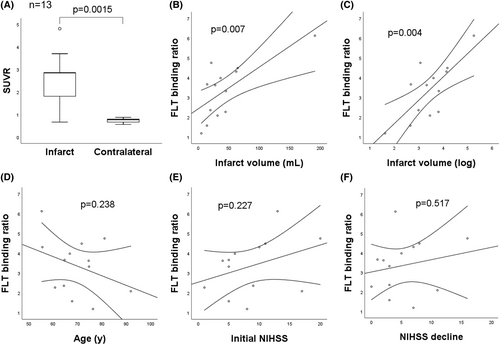
Representative DWI, FLT-PET, and fusion images are shown in Fig. 5. Upon visual inspection, the areas of increased FLT uptake overlapped nearly perfectly with the infarcted areas. The mean SUVR was higher in the infarcted regions compared to the mirrored contralateral regions (2.53 ± 1.11 vs. 0.75 ± 0.10, p = 0.0015) (Fig. 6A). The FLT-binding ratio showed a positive correlation with the infarct volume (r = 0.71, p = 0.007) and logarithm of infarct volume (r = 0.74, p = 0.004) (Fig. 6B,C). The FLT-binding ratio did not show significant correlation with age, initial NIHSS, and NIHSS decline (Fig. 6D–F). However, after adjusting for age, initial NIHSS correlated positively with the FLT-binding ratio (r = 0.61, p = 0.035) and early NIHSS decline showed a trend toward positive correlation with the FLT-binding ratio (p = 0.076); after additional adjustment for infarct volume, the significance was lost, but there was still a trend toward positive correlation between early NIHSS decline and FLT-binding ratio (p = 0.147). (Table S2).

As for the known neurogenic region SVZ, the mean SUVR of SVZ in the infarcted brain was higher than that of the contralateral side (0.93 ± 0.70 vs. 0.63 ± 0.07, p = 0.019). The FLT-binding ratio of SVZ showed significant positive correlation with the infarct volume (r = 0.84, p < 0.001), and a nonsignificant trend toward negative correlation with age (r = −0.30, p = 0.323) (Fig. S4).
Discussion
The present study shows that rats after ischemic stroke exhibited high FLT uptake in the ipsilateral striatum, frontal cortex, and temporal cortex, and that the FLT uptake signal gradually declined from poststroke 7 days to 28 days. The increased FLT uptake could be suppressed by the treatment with MAM, a neuroblast inhibitor. The change in poststroke FLT uptake activity was parallel to the change in cellular density of Ki-67 immunoreactive proliferating cells. The cerebral FLT-binding activity correlated positively with the infarct volume and neurological function of rats, suggesting that the extent of cell proliferation was closely associated with stroke severity. In rats with mild to moderate stroke severity, higher cerebral FLT-binding activity was associated with better neurological functional improvement. In patients with ischemic stroke, the FLT-binding activity robustly increased in the infarcted regions and correlated positively with the infarct volume and initial neurological deficits. In the known neurogenic region SVZ, the FLT-binding activity was increased ipsilateral to the ischemic stroke, and also showed positive correlation with infarct volume and initial neurological deficits. These results demonstrate that FLT PET is a useful noninvasive technique for assessing cerebral cell proliferation in a rat MCAO model and in patients with cerebral infarct.
FLT, a marker for cell proliferation, has been applied in stroke research in only a few reports. Rueger et al.13 detected increased FLT-binding activity in rat brains at the neural stem cell niche (namely SVZ and SGZ); the FLT-binding activity was further elevated after treatment with a neural proliferation enhancer or upon focal ischemic stroke. Ardaya et al.15 demonstrated increased FLT uptake in the cerebral ischemic territory with progressive decline of uptake signals from 7 to 28 days poststroke, which was paralleled to the number of proliferating microglia in time course. In the present study, an increase was found in FLT uptake activity in the infarcted rodent brain with gradual decline of the FLT uptake signals within poststroke 1 month. Focal cerebral ischemic insults trigger neural progenitor cells to proliferate in SVZ and SGZ, migrate toward the infarcted regions, and subsequently differentiate into neural precursor cells and mature neurons.22, 23 In addition, stroke induces rapid activation and proliferation of microglia cells, which are mainly derived from local expansion of resident microglia.5 Therefore, the FLT uptake activity detected by PET study likely represents poststroke cerebral cell proliferation resulting from neurogenesis and microgliosis. MAM, a neuroblast inhibitor,20 could suppress the increased FLT uptake activity in our study, providing supporting evidence that neurogenesis plays an important role in poststroke cell proliferation.
We also demonstrated that both infarct volume and initial neurological deficits of MCAO rats were positively associated with the cerebral FLT uptake activity, probably implying that the extent of neurogenesis and microgliosis after stroke is related to the severity of cerebral injury. Upon cerebral infarct, damaged brain tissue releases brain-derived growth factor, vascular endothelial growth factor, and stromal-derived factor-1α, to trigger proliferation and migration of neural progenitor cells.24 CX3CL1, lipocalin-2, and IL-4, derived from damaged neurons under ischemic stress, induce proliferation and regulate the polarization of microglia.25 Therefore, it is reasonable that more severe cerebral infarct produces more growth factors and chemokines, triggers more extensive neurogenesis and microgliosis, and shows higher cerebral FLT uptake activity in PET study.
In the present study, in rats with mild to moderate severity of ischemic stroke, higher cerebral FLT-binding activity was associated with better neurological functional improvement. For the first time, we demonstrated the benefits of poststroke cerebral cell proliferation in functional outcome using in vivo noninvasive imaging. Stroke-induced neurogenesis plays an important role in functional recovery, such that conditional ablation of neural precursors in adult mice diminished poststroke motor and cognitive functional improvement and reduced synaptic connectivity.8 Upon ischemic stroke, the reactivity of a subgroup of microglia also contributes to cell regeneration, anti-inflammation, and tissue recovery.9, 25 Therefore, cerebral FLT PET can be potentially applied to evaluate the prognosis of stroke via the analytical capacity of cerebral cell proliferation. However, in rats with severe stroke severity, the association between FLT uptake and stroke outcome was not seen, which may be because the benefits from poststroke neurogenesis and microgliosis are not strong enough to overcome the pernicious effects of massive cerebral infarct.
Notably, similar features of poststroke FLT uptake activity can be visualized in patients with cerebral infarct. In these patients in our study, high FLT uptake activity appeared most robustly in the infarcted areas. The FLT uptake activity also showed a positive correlation with the infarct volume. It is well known that aging is associated with reductions in neurogenesis capacity and stroke manifestations and recovery.26, 27 After adjusting for age, the FLT-binding ratio is likely to correlate positively with initial NIHSS and early NIHSS decline, although the latter did not reach statistical significance. After adding the adjustment for infarct volume, the significance was lost with only small trend toward positive correlation between early NIHSS decline and FLT-binding ratio, possibly because of small sample size. Future large study is still necessary to investigate the features of cerebral FLT uptake in patients with cerebral infarct. The known neurogenic region SVZ also showed increased FLT uptake activity in our study, which was positively correlated with infarct volume and showed a trend toward negative correlation with age, demonstrating the contribution of neurogenesis in the landscape of poststroke cell proliferation. Previous studies have shown that 18F-FLT PET is exceptionally safe due to the low dose injected, with nearly no adverse reaction reported28; however, a potential allergic response could not be completely excluded. Nevertheless, none of the patients receiving the FLT PET study developed adverse effects. The above results support the applicability of FLT PET in stroke patients with cerebral infarct.
The present study has several limitations. First, PET imaging is limited by its sensitivity and resolution, which may limit interpretation of results. In minor strokes, the FLT-binding activity is relatively weak, probably because of the small number of proliferating cells being activated. Therefore, the interpretation of FLT PET results in minor stroke may be relatively challenging. Furthermore, FLT PET study only detects overall proliferating signals but cannot clarify which type of specific proliferating cells are being visualized. In addition, nonspecific uptake of FLT is possible, with reasons such as (but not limited to) BBB disruption, contribution of metabolic factors, and relative activity of de novo and salvage pathways.29, 30 Finally, the small number of patients included in this study impedes detailed subgroup analysis for characteristics of cerebral FLT uptake in humans. Future large study is mandatory to investigate the relationship between cerebral FLT-binding activity and stroke features and functional outcomes.
In conclusion, the present study characterized in vivo FLT PET, a technique used to apply in oncology field, as a useful method for detecting cerebral cell proliferation in a rat model and a small group of patients with ischemic stroke. The promising results of FLT PET suggest that it can be potentially applied in clinical studies for noninvasive longitudinal monitoring of cerebral cell proliferation, especially in the field of poststroke stem cell biology and neuroinflammation.
Author Contributions
Conception and design: Pu-Tien Chiang, Hsin-Hsi Tsai, Ruoh-Fang Yen, and Li-Kai Tsai. Collection and assembly of data: Hsin-Hsi Tsai, Ruoh-Fang Yen, Yi-Chieh Tsai, Chi-Han Wu, Ching-Hung Chiu, and Li-Kai Tsai. Data analysis and interpretation: Pu-Tien Chiang, Hsin-Hsi Tsai, Ruoh-Fang Yen, and Li-Kai Tsai. Final approval of manuscript: Pu-Tien Chiang, Hsin-Hsi Tsai, Ruoh-Fang Yen, Yi-Chieh Tsai, Chi-Han Wu, Ching-Hung Chiu, and Li-Kai Tsai.
Acknowledgment
We are grateful for the technical support provided by the Microscopy Core Facility, Department of Medical Research, National Taiwan University Hospital. This work was supported by the National Taiwan University Hospital (109-A147 and 111-S0029).
Disclosures
The authors declare that they have no conflicts of interest.


