Uridine-responsive epileptic encephalopathy due to inherited variants in CAD: A Tale of Two Siblings
Abstract
We report two siblings with intractable epilepsy, developmental regression, and progressive cerebellar atrophy due to biallelic variants in the gene CAD. For the affected girl, uridine started at age 5 resulted in dramatic improvements in seizure control and development, cessation of cerebellar atrophy, and resolution of hematological abnormalities. Her older brother had a more severe course and only modest response to uridine started at 14 years old. Treatment of this progressive condition via uridine supplementation provides an example of precision diagnosis and treatment using clear outcome measures and biomarkers to monitor efficacy.
Introduction
The CAD gene encodes the multifunctional enzyme carbamoyl phosphate synthetase 2, aspartate transcarbamylase, and dihydroorotase 2 (abbreviated CAD), which plays a critical role in the de novo pyrimidine synthesis pathway.1 Biallelic CAD variants cause a severe neurometabolic disorder associated with developmental delay and epilepsy (known as CAD deficiency, or uridine-responsive epileptic encephalopathy). Additional features include abnormal gait, progressive cerebellar atrophy, and hematologic abnormalities.1, 2 Features of CAD deficiency partly overlap with those of congenital disorders of glycosylation (CDG), but conventional CDG studies are reportedly normal.1, 2 Whole exome sequencing is currently the primary means of identifying CAD deficiency.
Here we report two siblings with novel biallelic CAD variants, with differences in phenotypic severity, timing of genetic diagnosis, and response to uridine. We demonstrate outcomes and biomarkers relevant to CAD deficiency and examine the spatiotemporal expression of CAD as it relates to key features of this disorder.
Case presentations
Patient 1 (proband)
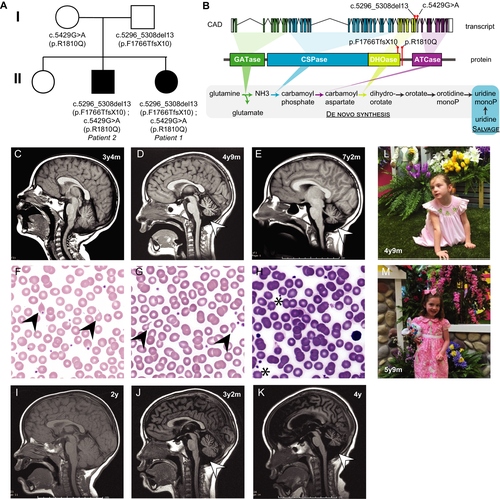
Patient 1, a girl, is the third child born to nonconsanguineous parents (Fig. 1A). She has an affected older brother (Patient 2, below) and healthy older sister.

Patient 1 had delayed fine motor and language development, normal gross motor development, and a diagnosis of autism spectrum disorder at 2 years. Seizures began at 3.5 years with generalized tonic-clonic (GTC) seizures. She later developed myoclonic seizures, focal motor seizures with secondarily generalized tonic-clonic activity and postictal paresis (3-4/week), and frequent atonic and absence seizures (up to 100/day). After a prolonged seizure at 4 years 8 months, she displayed low tone, could no longer ambulate independently, and plateaued in language skills. She had poor growth with head circumference 103 cm (−0.69 standard deviation [SD] for age) and weight 15.6 kg (−0.88 SD) at age 4 years 9 months. Trials of antiseizure medications (ASMs) did not reduce seizure frequency.
Brain MRI, normal at 3 years 4 months, showed mild cerebellar atrophy by 4 years 9 months (Fig. 1C-D). Serum testing for CDG, including N-glycan testing and transferrin isoelectric focusing, was normal. Urinary orotic acid and urinary pyrimidine panel were normal. Initial laboratory testing revealed mild macrocytosis without anemia, with red blood cell distribution at the upper limit of normal. Blood smear, evaluated after identification of CAD variants, showed moderate anisocytosis and poikilocytosis (Fig. F-G).
Patient 2
Patient 2 is the older brother of Patient 1 (Fig. 1A). He presented with delayed language and normal gross motor development. At 2 years, he had an onset of intractable GTCs (0-2 per day). Atonic seizures began at 3 years. An episode of febrile status epilepticus (SE) at 3.5 years led to a 6-month hospitalization that included pentobarbital coma, focal temporal lobe resection, and ventriculoperitoneal shunt placement. Subsequently, he showed substantial deterioration and remains nonverbal and tracheostomy-dependent. Seizure control remained poor despite multiple ASM trials.
Brain MRI from 2 years old was normal (Fig. 1I); cerebellar atrophy was present at 3.5 years old (Fig. 1J). MRI at 4 years showed prominent hydrocephalus and ex vacuo changes with supratentorial and cerebellar atrophy (Fig. 1K). Routine laboratory testing was unremarkable, including normal CBC (Table 1).
| Patient 1, F | Patient 2, M | |
|---|---|---|
| Early developmental abnormalities | Delayed fine motor and language; esotropia; poor growth | Delayed language; esotropia |
| Epilepsy history | ||
| Onset | 3.5 years | 2 years |
| Seizure types (frequency) | GTCS, myoclonic, focal motor seizures with postictal paresis (3-4/wk); atonic and absence (100s/day) | GTCS (5-10/day), atonic, status epilepticus |
| Electroencephalographic (EEG) abnormalities | Diffuse background slowing, generalized spike-and-slow wave (4y) | Disorganized background, focal onset seizures, tonic seizures correlating with paroxysmal fast activity |
| Hematologic testing at presentation | ||
| MCV (range, 75-87 fL) | Elevated (94.9 fL) | Reported normal |
| Hemoglobin (range, 11.5–15.5 g/dL) | Normal (13.1 g/dL) | Reported normal |
| RDW (range, 11.5-15) | Upper limit of normal (14.7%) | Reported normal |
| Blood smear | Moderate anisocytosis, poikilocytosis | Not assessed |
| CDG testing | Normal | Not assessed |
| MRI abnormalities | Mild cerebellar atrophy (4 years, 9 months) | Cerebellar atrophy (3.5 years) |
| Uridine supplementation | ||
| Initiation | 5 years | 14 years |
| Development | Motor activity, weight/HC -- normalized | Eye contact and expression -- improved |
| Seizures | GTCS/myoclonic/focal seizures – resolved.Absence seizures -- improved (few per day) | GTCS -- improved (0-3 daily) |
| EEG | Improved background organization, ongoing focal sharps and generalized spike-and-slow-wave discharges | Not assessed |
| Blood smear | Normalized | Not assessed |
| MRI | Stabilized | Stabilized |
Genetic testing and identification of CAD variants as disease-relevant
Whole exome sequencing revealed biallelic variants in CAD in both siblings (Table 2). The paternally inherited heterozygous c.5296_5308del13 deletion in CAD causes a 13-base pair deletion resulting in a frameshift in the DHOase domain and a prematurely truncated protein lacking the last 455 of 2225 amino acids; it is predicted pathogenic by American College of Medical Genetics (ACMG) criteria.3 The maternally inherited heterozygous c.5429G > A missense variant causes an arginine to glutamine substitution within the DHOase domain (Fig A, B) and is classified as likely pathogenic.
| Gene | Variant | Effect on protein |
Reference db SNP |
Prediction | Allele frequency in heterozygotes (gnomAD) | Allele frequency in homozygotes (gnomAD) | ClinVar | CADD | REVEL | MetaLR | Mutation Assessor | SIFT | Polyphen | |
|---|---|---|---|---|---|---|---|---|---|---|---|---|---|---|
| 1 | CAD | c.5296_5308del13 | p.Phe1766TfsX10 | rs1019263242 | pathogenic | 6.4x10⁻⁵ | 0 | + | n/a | n/a | n/a | n/a | n/a | n/a |
| 2 | CAD | c.5429G > A | p.Arg1747Gln | rs139332887 |
likely pathogenic |
3.52x10⁻⁴ | 0 | + | 23 | 0.46 | 0.854 | 0.706 | 0.01 | 0.478 |
| 3 | GRIN2A | c.2859G > C | p.E953D | rs749810424 | VUS | 7x10-56 | 0 | - | 9 | 0.66 | 0.009 | 0.022 | 1 | 0 |
| 4 | KIF26A | c.5494G > A | p.E1832K | rs756446886 | VUS | 6.8x10⁻⁵ | 0 | - | 27 | 0.463 | 0.635 | 0.54 | 0 | 0.955 |
| 5 | KIF26A | c.1643C > T | p.P548L | rs201175395 | VUS | 4.5x10⁻⁴ | 0 | - | 24 | 0.54 | 0.561 | 0.739 | 0 | 0.997 |
The phenotype of Patients 1 and 2 is consistent with that reported in association with CAD.1, 2, 4, 5 An unbiased serum metabolomic screen (Global Metabolomic Assisted Pathway Screen, Baylor Genetics) later demonstrated significantly reduced orotic acid (−3.4, Z-score) and orotidine (−2, Z-score) in Patient 1, consistent with disruption in the pyrimidine synthesis pathway (Fig. 1B), providing additional biochemical confirmation of CAD deficiency.
The patients also share variants of uncertain significance (VUS) in genes not known to be associated with their phenotype (Table 2). Chromosomal microarray was normal.
Spatiotemporal expression profile of CAD in adult and developing humans
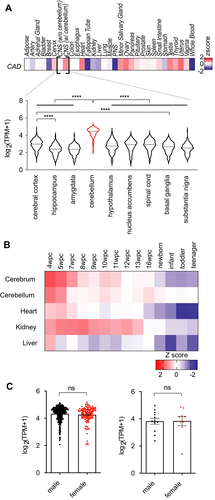
To better understand the role of CAD function in the brain, we surveyed the spatiotemporal expression profile of CAD using publicly available human RNA sequencing data (Fig. 2; Supplemental Methods).

In adults, CAD expression is highest in sex-specific tissues and peripheral nervous system (Z-score, 1.0) and lowest in heart, muscle, and whole blood (Fig. 2A). In the central nervous system (CNS), CAD expression is highest in cerebellum (Z-score, 0.6), with levels in the top 30th percentile (9th of 31) of queried tissues. All other queried regions of CNS have low CAD expression (overall Z-score, −1.5; bottom 10th percentile, 28th of 31).
In developing humans, CAD expression in five tissues (cerebrum, cerebellum, heart, kidney, liver) is highest during early embryogenesis (Fig. 2B) and gradually falls over time. Its highest level overall is in cerebrum at 4 weeks postconception (w.p.c.) (Z-score, 1.97; top 97th percentile across all tissues and timepoints). Postnatally, CAD expression in cerebrum falls over time (Z-score range, −0.59 to −1.34), while expression in the cerebellum falls less drastically, becoming more highly expressed than in the cerebrum (Z-score range, −0.11 to 0.21), suggesting sustained function in cerebellum compared to other organs. We did not observe sex-specific differences in CAD expression in the cerebellum (Fig. 2C).
Patients’ responses to uridine treatment
After genetic diagnosis, we initiated oral uridine supplementation (off-label), which has been used safely for CAD1, 5 and related metabolic conditions.6
Patient 1
Oral uridine (100mg/kg/day) was initiated at 5 years old. Within 6 months, gross motor development improved dramatically (Fig. 1M). She could run, somersault, and by age 7 swim independently. Her cognitive and language abilities improved; she recognizes letters and speaks short phrases. Fine motor skills also improved. Weight normalized: at 7 years 3 months she weighed 25kg (+0.53 SD).
Seizure control markedly improved. She had a single GTC soon after starting uridine and none since. At 8 years old, she remains free of GTCs and atonic seizures. Nondisabling absence seizures became less frequent but still occur daily. Clobazam and rufinamide had been added coincident with uridine; no further modifications to her regimen have been required. Uridine was increased step-wise, guided in part by initial incomplete resolution of blood smear abnormalities, to 2700mg daily (~108 mg/kg/day). Blood smear now shows resolution of anisocytosis and poikilocytosis (Fig. 1H). Brain MRI at 7 years 2 months (Fig. 1E) demonstrated stabilization of infratentorial atrophy with no change in a 2.5-year interval.
Patient 2
Oral uridine (100 mg/kg/day) was initiated at 14 years old. Seizure frequency decreased from 5-10 daily GTCs to 0-3 daily GTCs. Baseline health improved, with fewer infections and hospitalizations. He remains nonverbal and 100% dependent on care but is more engaged with family with regard to eye contact and emotional expression.
Discussion
Our report of dramatic response to uridine treatment in Patient 1 demonstrates that CAD deficiency is treatable, providing the longest follow-up reported to date (3 years). Earlier studies of patients with CAD deficiency have reported improvement up to 7 months following oral uridine supplementation1, 5, while two additional reports2, 4 do not provide details regarding the uridine response.
Despite sharing the same variants in CAD, Patient 2 presented with earlier and more severe seizures, earlier cerebellar atrophy (Fig. 1C,J), and more advanced cerebral and cerebellar atrophy (Fig. 1D,K) compared to his sister. Another study also reports a more severe male phenotype between two siblings.1 At the same time, late oral uridine supplementation in Patient 2 has resulted in less improvement than in Patient 1, suggesting that early diagnosis leading to early treatment is more effective.
The spatiotemporal profile of CAD expression suggests a role for CAD function in cerebellar development and function, which may have implications for disease pathophysiology. The gait dysfunction and cerebellar degeneration in patients with CAD deficiency may relate to a high demand for CAD in cerebellar tissue. How CAD function of the cerebellum relates to epilepsy in these patients, if at all, remains a mystery. There is no evidence of a sex-specific difference in CAD expression to explain the observed male–female difference in severity between siblings with shared CAD variants.
We demonstrate that seizure frequency, developmental progress, MRI stabilization, and RBC normalization are appropriate measures for trials of uridine therapy for CAD deficiency. We recommend documentation of seizure frequency and formal developmental assessment at regular intervals, and MRI and blood smear evaluation to monitor disease stabilization and biochemical response to treatment. Our report underscores the urgency for CAD deficiency to be included in early diagnostic efforts, such as newborn screening. Abnormally low serum orotic acid and orotidine may be specific markers of CAD deficiency, particularly in patients whose presentations suggest CDG with negative biochemical testing, or in affected patients whose genetic work-up reveals biallelic variants of uncertain significance in CAD. Given its imminently treatable nature, CAD deficiency should be considered early in the evaluation of epilepsy and developmental delay with regression.
Acknowledgments
We are most grateful to the family whose children we describe for their permission to report our findings (including publication of the provided photographs) and for graciously reviewing the manuscript. We are also grateful to Patricia Dean, RN, Epilepsy Foundation of Florida, for facilitating our collaboration.
Conflicts of Interest
None to report.
Authors’ contributions
CMM, SM, and AP drafted the manuscript. HYK performed expression analysis. All authors provided data analysis and interpretation and contributed to the editing of the manuscript.


