Efficacy of delayed-release dimethyl fumarate in relapsing-remitting multiple sclerosis: integrated analysis of the phase 3 trials
Abstract
Objective
Obtain a more precise estimate of the efficacy of delayed-release dimethyl fumarate (DMF; also known as gastro-resistant DMF) in relapsing multiple sclerosis (MS) and examine the consistency of DMF's effects across patient subgroups stratified by baseline demographic and disease characteristics.
Methods
A prespecified integrated analysis of the randomized, double-blind, placebo-controlled, Phase 3 DEFINE and CONFIRM trials was conducted.
Results
The intent-to-treat population comprised 2301 patients randomized to receive placebo (n = 771) or DMF 240 mg twice daily (BID; n = 769) or three times daily (TID; n = 761). At 2 years, DMF BID and TID reduced the annualized relapse rate by 49% and 49% (both P < 0.0001), risk of relapse by 43% and 47% (both P < 0.0001), risk of 12-week confirmed disability progression by 32% (P = 0.0034) and 30% (P = 0.0059), and risk of 24-week confirmed disability progression by 29% (P = 0.0278) and 32% (P = 0.0177), respectively, compared with placebo. In a subset of patients (MRI cohort), DMF BID and TID reduced the mean number of new/enlarging T2-hyperintense lesions by 78% and 73%, gadolinium-enhancing lesion activity by 83% and 70%, and mean number of new nonenhancing T1-hypointense lesions by 65% and 64% (all P < 0.0001 vs. placebo). Effects were generally consistent across patient subgroups.
Interpretation
The integrated analysis provides a more precise estimate of DMF's efficacy. DMF demonstrated a robust reduction in disease activity and a consistent therapeutic effect across patient subgroups.
Introduction
The response of individual patients to available treatments for multiple sclerosis (MS) can differ dramatically, underscoring the need for new therapeutic options with novel mechanisms of action, strong efficacy, and an acceptable safety profile. Delayed-release dimethyl fumarate (DMF; also known as gastro-resistant DMF) is a novel oral agent for the treatment of relapsing MS. Evidence from preclinical studies suggests that DMF exerts anti-inflammatory and cytoprotective activity mediated in part through the nuclear factor (erythroid-derived 2)-like 2 (Nrf2) transcriptional pathway.1, 2
In the Phase 3 DEFINE3 and CONFIRM4 trials, DMF 240 mg twice daily (BID) and three times daily (TID) demonstrated efficacy across a broad range of clinical and MRI endpoints over a 2-year time period, combined with an acceptable safety profile. In both studies, DMF significantly reduced the annualized relapse rate (ARR), risk of relapse, mean number of new/enlarging T2-hyperintense lesions, odds of having more gadolinium-enhancing (Gd+) lesions, and mean number of new nonenhancing T1-hypointense lesions, relative to placebo. DMF also reduced the risk of 12-week confirmed disability progression in both studies, but the effect was statistically significant in DEFINE only. The lack of a significant effect on 12-week confirmed disability progression in CONFIRM may have been related to the lower rate of disability progression in the placebo group in CONFIRM compared with DEFINE, which contributed to decreased assay sensitivity of the study.
To further investigate the therapeutic effect of DMF, a prespecified integrated analysis of efficacy and safety data from DEFINE and CONFIRM was conducted. The integrated analysis, which has increased sample size compared with the individual studies derived from the greater number of patients analyzed (over 750 patients per treatment group), has two clear benefits with regard to efficacy endpoints: it allows for a more precise estimate of DMF's therapeutic effect than can be obtained from either study in isolation, and it permits evaluation of the consistency of this effect across prespecified patient subgroups, with reduced variability. Data pooling was achievable because of the many similarities between the studies: both were multicenter, placebo-controlled, parallel-group trials with equal treatment group randomization ratios; both were conducted in the same regions; both involved the same dosing regimens of DMF, nearly identical inclusion/exclusion criteria, and the same efficacy endpoints measured at the same time points, using the same criteria to define clinical relapses and disease progression and the same Independent Neurological Evaluation Committee members to confirm relapses; and in both, the same MRI lesion methodology was used across MRI reader centers. Importantly, the integrated analysis was to be conducted only if baseline characteristics and treatment effects were homogeneous across the studies.
Here, we describe the results of the integrated analysis of efficacy endpoints in the overall intent-to-treat (ITT) population (MRI cohort for MRI endpoints) and in patient subgroups stratified by baseline demographics and disease characteristics. The results of the integrated analysis of safety endpoints are described in a companion publication.
Patients and Methods
Patients and study design
Methodological details of the DEFINE (NCT00420212) and CONFIRM (NCT00451451) studies have been reported previously.3, 4 Briefly, DEFINE and CONFIRM were multicenter, randomized, double-blind, placebo-controlled, parallel-group, 2-year, Phase 3 studies of DMF in people with relapsing MS. Eligible patients were aged 18–55 years and had a confirmed diagnosis of relapsing-remitting MS (RRMS) according to McDonald criteria5; an Expanded Disability Status Scale (EDSS) score6 of 0–5.0, inclusive; and at least one clinically documented relapse within 1 year prior to randomization with a prior brain MRI demonstrating lesions consistent with MS, or at least one Gd+ lesion on a brain MRI scan obtained within 6 weeks prior to randomization. Patients were recruited at 198 sites in 28 countries.
In DEFINE, patients were randomized to receive DMF 240 mg BID or TID or placebo for up to 96 weeks. In CONFIRM, patients were randomized to receive DMF 240 mg BID or TID, placebo, or glatiramer acetate (GA; reference comparator) 20 mg injected subcutaneously once daily for up to 96 weeks. Patients receiving GA were aware of their group assignment. Randomization was performed centrally and stratified according to site. In both studies, patients randomized at sites with validated MRI capabilities had the option of participating in the MRI portion of the study (MRI cohort). Neurological exams, conducted by an examining neurologist who was blinded to the patients' treatment assignments, were held every 12 weeks for efficacy assessments and at the time of suspected relapse. MRI scans were scheduled at baseline and weeks 24, 48, and 96.
The primary endpoints of DEFINE and CONFIRM were the proportion of patients relapsed and ARR, respectively, at 2 years. Additional endpoints at 2 years included 12-week confirmed disability progression as measured by EDSS, number of new or enlarging T2-hyperintense lesions, number of Gd+ lesions, and number of new nonenhancing T1-hypointense lesions, all at 2 years. A preplanned sensitivity analysis was performed in which disability progression was to be confirmed after 24 weeks. Patients had the option of discontinuing study treatment and initiating treatment with an approved, open-label, alternative MS medication if they completed 48 weeks of study treatment and experienced one or more confirmed relapses after 24 weeks (DEFINE) or if they completed 48 weeks of study treatment and experienced two confirmed relapses at any time (CONFIRM). In both studies, patients had the option of discontinuing study treatment and initiating treatment with an approved, open-label, alternative MS medication if they had 12-week confirmed progression of disability at any time.
Statistical analysis
The preplanned integrated analysis included patients randomized to receive placebo or DMF BID or TID. Patients randomized to receive GA were excluded from this analysis because there was no GA comparator arm in DEFINE, and because CONFIRM was not designed to test the superiority or noninferiority of DMF to GA.
The integrated efficacy analysis was performed on data from the ITT population, which included patients who underwent randomization and received at least one dose of study drug. MRI endpoints were analyzed using ITT patients in the MRI cohort for whom at least one MRI scan was available for analysis. Data from patients who elected to switch to an alternative MS treatment were excluded as of the date the alternative treatment was administered. MRI lesion count data post-early withdrawals or post-alternative MS treatment usage were imputed using a constant rate assumption. Since the main purpose of the integrated analysis was to provide a more precise estimate of the treatment effect of DMF rather than hypothesis testing, no adjustment for multiplicity was made in analyses of pooled data.
ARR (total number of relapses divided by patient-years in the study, excluding data obtained after patients switched to alternative MS medications) was analyzed with the use of a negative binomial regression model adjusted for region (1 [United States], 2 [Western European countries, Canada, Costa Rica, Australia, New Zealand, Israel, and South Africa], or 3 [Eastern European countries, India, Guatemala, and Mexico]); baseline age (<40 vs. ≥40 years); baseline EDSS score (≤2.0 vs. >2.0); number of relapses in the year prior to study entry; and study (DEFINE vs. CONFIRM). Regions were predefined based on geography, type of health care system, and access to health care in each country. The proportion of patients relapsed was derived using Kaplan–Meier analysis and analyzed with the use of a Cox proportional hazards model,7, 8 with study as a stratifying factor and adjusted for region, baseline age (<40 vs. ≥40 years), baseline EDSS score (≤2.0 vs. >2.0), and number of relapses in the year prior to study entry. For subgroup analyses, the same statistical models were used except for the subgroup factor of interest (see below). Disability progression as measured by EDSS (12-week and 24-week confirmation) was analyzed using a Cox proportional hazards model with study as a stratifying factor, and adjusted for the following covariates: region, baseline EDSS score (as a continuous variable), and baseline age (<40 vs. ≥40 years). Negative binomial regression was used to analyze the number of new or enlarging T2-hyperintense lesions (covariates: region, study and baseline T2-hyperintense volume) and the number of new T1-hypointense lesions (covariates: region, study, and baseline T1-hypointense volume). Ordinal logistic regression was used for the analysis of the odds of having new Gd+ lesions (covariates: region, study, and baseline number of Gd+ lesions).
Subgroup analyses
Additional efficacy analyses were conducted to evaluate clinical endpoints (ARR, risk of relapse, and risk of 12-week confirmed disability progression) and MRI endpoints (mean number of T2-hyperintense lesions, number of Gd+ lesions, and mean number of new nonenhancing T1-hypointense lesions) at 2 years in prespecified patient subgroups stratified by gender, age (<40 or ≥40 years), region (1, 2, or 3), relapses in the year prior to study entry (≤1 or ≥2), McDonald criteria (1 or 2–4), prior MS treatment (treated or treatment-naïve), EDSS score (≤2.0 or >2.0), T2-hyperintense lesion volume (MRI cohort only; ≤median or >median), and Gd+ lesions (MRI cohort only; absent or present).
Results
Study population
The ITT population for the integrated efficacy analysis comprised 2301 patients randomized to receive placebo (n = 771) or DMF BID (n = 769) or TID (n = 761). The MRI cohort comprised a subset of 1046 patients randomized to receive placebo (n = 347) or DMF BID (n = 345) or TID (n = 354). The demographic and baseline disease characteristics of the MRI cohort were similar to those of the non-MRI cohort. Baseline demographic and disease characteristics were similar across treatment groups (Table 1). There were slight differences between DEFINE and CONFIRM in baseline characteristics, regional enrollment, and rescue criteria, but these differences were not associated with a substantially different treatment effect and did not preclude a pooled analysis. Both DEFINE and CONFIRM included a broad spectrum of patients with relapsing MS as reflected by the population baseline characteristics.
| Characteristica | DEFINE | CONFIRM | Pooled analysis | ||||||
|---|---|---|---|---|---|---|---|---|---|
| Placebo (n = 408) | DMFb BID (n = 410) | DMFb TID (n = 416) | Placebo (n = 363) | DMFb BID (n = 359) | DMFb TID (n = 345) | Placebo (n = 771) | DMFb BID (n = 769) | DMFb TID (n = 761) | |
| Female, % | 75 | 72 | 74 | 69 | 68 | 72 | 72 | 70 | 73 |
| Age, years | 38.5 ± 9.1 | 38.1 ± 9.1 | 38.8 ± 8.9 | 36.9 ± 9.2 | 37.8 ± 9.4 | 37.8 ± 9.4 | 37.7 ± 9.2 | 37.9 ± 9.2 | 38.3 ± 9.1 |
| <40, % | 50 | 55 | 51 | 59 | 58 | 56 | 54 | 56 | 53 |
| ≥40, % | 50 | 45 | 49 | 41 | 42 | 44 | 46 | 44 | 47 |
| Race, % white | 78 | 78 | 79 | 84 | 85 | 85 | 81 | 81 | 82 |
| Region, %c | |||||||||
| 1 | 16 | 16 | 17 | 20 | 18 | 19 | 18 | 17 | 18 |
| 2 | 42 | 42 | 42 | 15 | 15 | 15 | 29 | 30 | 30 |
| 3 | 42 | 42 | 41 | 65 | 67 | 66 | 53 | 53 | 53 |
| Years since MS diagnosis, median (range) | 4 (0, 31) | 4 (0, 32) | 3 (0, 23) | 4 (0, 33) | 3 (0, 30) | 3 (0, 27) | 4 (0, 33) | 4 (0, 32) | 3 (0, 27) |
| Any prior MS treatment, % | 56 | 54 | 55 | 40 | 41 | 40 | 49 | 48 | 48 |
| Prior approved MS treatment, %d | 42 | 40 | 40 | 31 | 28 | 29 | 37 | 34 | 35 |
| Relapses in year prior to study | 1.3 ± 0.7 | 1.3 ± 0.7 | 1.3 ± 0.6 | 1.4 ± 0.8 | 1.3 ± 0.6 | 1.4 ± 0.7 | 1.3 ± 0.7 | 1.3 ± 0.7 | 1.3 ± 0.7 |
| ≤1, % | 71 | 70 | 73 | 69 | 71 | 65 | 71 | 70 | 69 |
| ≥2, % | 29 | 30 | 27 | 31 | 29 | 35 | 29 | 30 | 31 |
| EDSS score | 2.5 ± 1.2 | 2.4 ± 1.3 | 2.4 ± 1.2 | 2.6 ± 1.2 | 2.6 ± 1.2 | 2.5 ± 1.2 | 2.5 ± 1.2 | 2.5 ± 1.3 | 2.4 ± 1.2 |
| ≤2.0, % | 50 | 52 | 54 | 44 | 45 | 46 | 47 | 49 | 50 |
| >2.0, % | 50 | 48 | 46 | 56 | 55 | 54 | 53 | 51 | 50 |
| McDonald criteria, % | |||||||||
| 1 | 83 | 82 | 78 | 85 | 81 | 82 | 84 | 82 | 80 |
| 2–4 | 17 | 18 | 22 | 15 | 19 | 18 | 16 | 18 | 20 |
| T2-hyperintense lesion volume,e cm3 | 6.5 ± 7.6 | 8.5 ± 10.1 | 9.0 ± 11.8 | 14.6 ± 13.3 | 13.9 ± 13.3 | 12.8 ± 13.4 | 10.4 ± 11.4 | 11.1 ± 12.1 | 10.8 ± 12.7 |
| Gd+ lesions,e number | 1.6 ± 3.5 | 1.2 ± 3.3 | 1.2 ± 4.1 | 2.7 ± 7.7 | 2.7 ± 6.2 | 1.9 ± 5.0 | 2.2 ± 5.9 | 1.9 ± 5.0 | 1.5 ± 4.6 |
| Absent, % | 57 | 66 | 67 | 52 | 51 | 56 | 55 | 59 | 62 |
| Present, % | 43 | 34 | 33 | 48 | 49 | 44 | 45 | 41 | 38 |
| T1-hypointense lesion volume,e cm3 | 2.2 ± 4.0 | 3.1 ± 4.7 | 3.3 ± 5.0 | 3.7 ± 5.3 | 3.6 ± 5.2 | 3.1 ± 4.6 | 2.9 ± 4.7 | 3.3 ± 4.9 | 3.2 ± 4.8 |
- ITT, intent-to-treat; BID, twice daily; TID, three times daily; MS, multiple sclerosis; EDSS, Expanded Disability Status Scale; Gd+, gadolinium-enhancing.
- a Values are mean ± SD unless otherwise stated.
- b DMF, delayed-release DMF (also known as gastro-resistant DMF).
- c Region 1, United States; Region 2: Canada, Western European countries, Israel, new Zealand, Australia (DEFINE only), South Africa (DEFINE only), and Costa Rica (CONFIRM only); Region 3: Eastern European countries, India, Mexico, and Guatemala (DEFINE only).
- d Interferon beta, glatiramer acetate, or natalizumab.
- e MRI performed in a subset of patients (MRI cohort): placebo (n = 347), DMF BID (n = 345), DMF TID (n = 354).
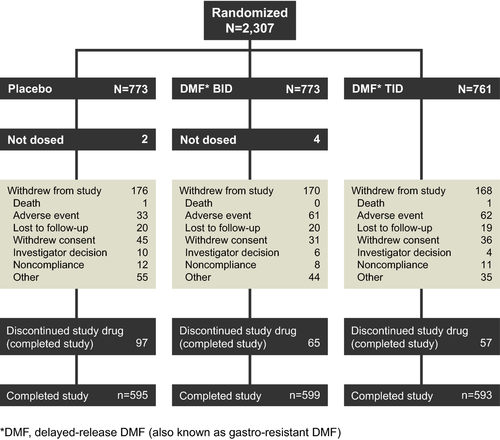
A total of 1787 patients (78%) completed the study (77% of the placebo group and 78% of each DMF group; Fig. 1). The rate of study drug discontinuation was higher in the placebo group (35%) than in the DMF BID (30%) and TID (29%) groups due to lack of efficacy or higher rates of MS relapse in the placebo group. A greater percentage of patients in the placebo group (12%) than in the DMF BID (7%) and TID (6%) groups switched to alternative MS therapies.
Clinical endpoints
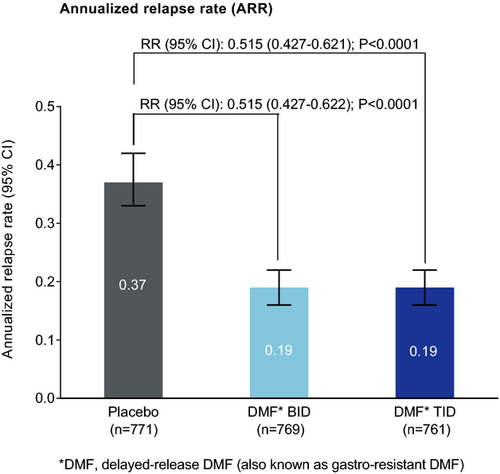
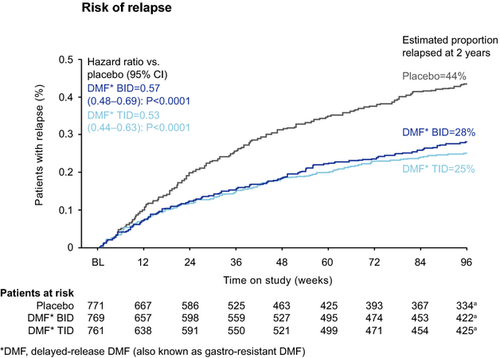
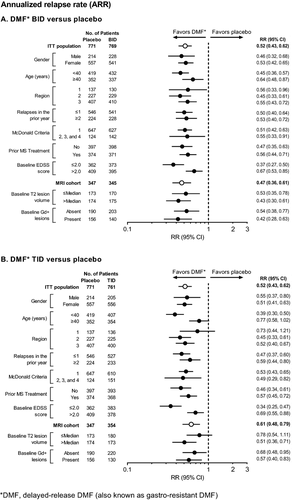
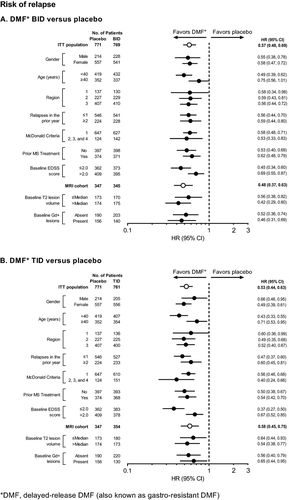
The frequency of relapse was reduced significantly by DMF treatment, with an adjusted ARR of 0.19 in both DMF groups compared with 0.37 in the placebo group, representing relative reductions of 49% (P < 0.0001 for both comparisons; Fig. 2). DMF treatment also significantly reduced the risk of relapse compared with placebo by 43% (BID) and 47% (TID; Fig. 3). On the basis of Kaplan–Meier estimates, 28% and 25% of patients in the DMF BID and TID groups, respectively, experienced at least one MS relapse by 2 years, compared with 44% of patients in the placebo group (P < 0.0001 for both comparisons).
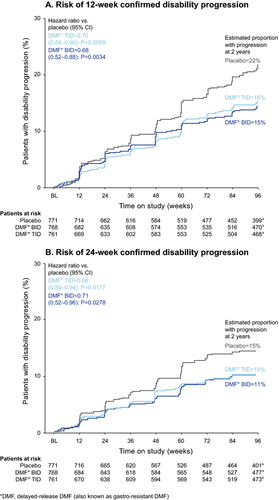
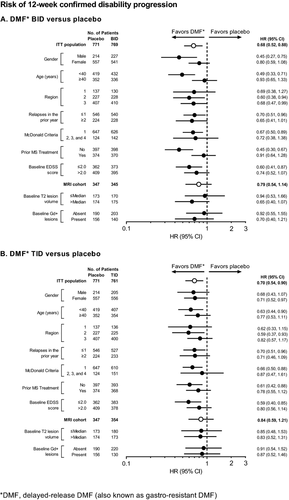
The risk of 12-week sustained progression of disability over 2 years was reduced significantly among patients receiving DMF BID (32%) and TID (30%) compared with patients in the placebo group. On the basis of Kaplan–Meier estimates, 15% and 16% of patients in the DMF BID and TID groups, respectively, experienced 12-week sustained progression of disability over 2 years, compared with 22% of patients in the placebo group (P = 0.0034 and P = 0.0059 for DMF BID and TID, respectively; Fig. 4A). The risk of 24-week sustained progression of disability was also reduced significantly among patients receiving DMF BID (29%) and TID (32%) compared with patients in the placebo group. On the basis of Kaplan–Meier estimates, 11% and 10% of patients in the DMF BID and TID groups, respectively, experienced 24-week sustained progression of disability over 2 years, compared with 15% of patients in the placebo group (P = 0.0278 and P = 0.0177 for DMF BID and TID, respectively; Fig. 4B).
MRI endpoints
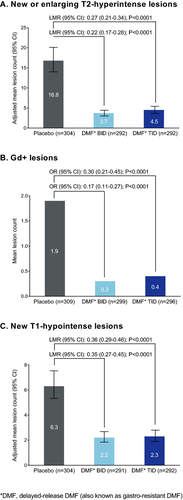
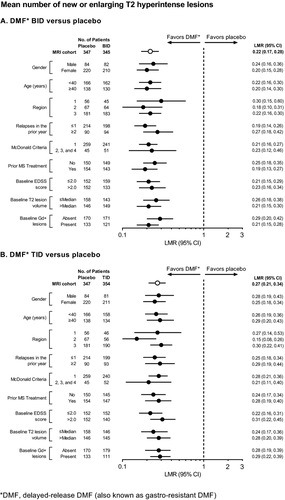
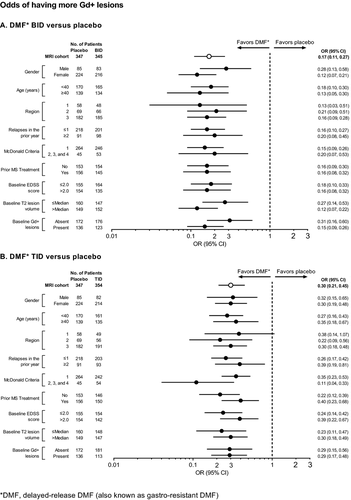
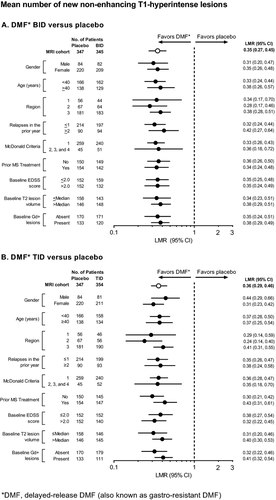
The number of new or enlarging T2-hyperintense lesions, odds of having more Gd+ lesions, and mean number of new nonenhancing T1-hypointense lesions were reduced significantly by DMF treatment at 2 years. The number of new or enlarging T2-hyperintense lesions was reduced by 78% (BID) and 73% (TID) compared with placebo (P < 0.0001 for both comparisons; Fig. 5A). The percentage of patients free from new or enlarging T2-hyperintense lesions was 36% in both DMF groups compared with 20% in the placebo group. The odds of having more Gd+ lesions were reduced by 83% (BID) and 70% (TID) compared with placebo (P < 0.0001 for both comparisons; Fig. 5B). The percentage of patients free from Gd+ lesions was 87% in the DMF BID group, 83% in the DMF TID group, and 62% in the placebo group. The mean number of new nonenhancing T1-hypointense lesions was reduced by 65% (BID) and 64% (TID) compared with placebo (P < 0.0001 for both comparisons; Fig. 5C). The percentage of patients free from new nonenhancing T1-hypointense lesions was 40% in the DMF BID group, 45% in the DMF TID group, and 29% in the placebo group.
Subgroup analyses
Clinical endpoints
ARR at 2 years (the primary endpoint of CONFIRM) was reduced by both dosing regimens of DMF compared with placebo in all prespecified patient subgroups (Fig. 6). Across the subgroups, ARR estimates for the placebo group ranged from 0.25 to 0.52, compared with 0.13–0.28 in the DMF BID group and 0.12–0.31 in the DMF TID group. DMF BID and TID reduced the ARR by 33–63% and 22–66%, respectively, across the subgroups.
Effects of DMF treatment on risk of relapse at 2 years (the primary endpoint of DEFINE) were generally similar to the results for ARR (Fig. 7). Across the subgroups, the proportion of patients who experienced at least one relapse ranged from 34% to 55% in the placebo group, compared with 21–36% in the DMF BID group and 18–36% in the DMF TID group. DMF BID and TID reduced the risk of relapse by 25–58% and 29–63%, respectively, across the subgroups.
The proportion of patients who experienced 12-week sustained progression of disability over 2 years ranged from 18% to 27% across the subgroups in the placebo group, compared with 10–20% in the DMF BID group and 14–23% in the DMF TID group (Fig. 8). DMF BID and TID reduced the risk of 12-week confirmed disability progression by 6–55% and 9–41%, respectively, across the subgroups.
MRI endpoints
Across the subgroups, at 2 years, DMF BID and TID reduced the mean number of new or enlarging T2-hyperintense lesions by 70–82% and 69–85% (Fig. 9), the odds of having more Gd+ lesions by 69–88% and 60–89% (Fig. 10), and the mean number of new nonenhancing T1-hypointense lesions by 58–72% and 56–76% (Fig. 11), respectively.
Discussion
This integrated analysis of DEFINE and CONFIRM, which was based on a population comprising more than 750 patients per treatment group, provides a more precise estimate of DMF's therapeutic effect than was obtainable in either study in isolation. Over 2 years, DMF 240 mg BID and TID demonstrated significant and sustained reductions versus placebo on a range of clinical and MRI outcome measures in the overall ITT population and MRI cohort and across patient subgroups. In terms of clinical endpoints, treatment with DMF reduced ARR, risk of relapse, and risk of 12-week and 24-week confirmed disability progression, compared with placebo. On MRI endpoints, DMF reduced the mean number of new or enlarging T2-hyperintense lesions, Gd+ lesion activity, and mean number of new nonenhancing T1-hypointense lesions, compared with placebo. Hence, the robust data set of the integrated analysis corroborates the clinical and neuroradiological findings from the individual studies, including the finding from DEFINE that DMF therapy significantly reduces the risk of confirmed disability progression.
A major benefit of the integrated analysis is that it allows for further investigation of treatment effects in subgroups of patients stratified by baseline demographic and disease characteristics. Whereas previous subgroup analyses of DEFINE and CONFIRM were limited by sample size, particularly with regard to neuroradiological endpoints measured in a subset of patients,9, 10 the integrated analysis could examine a range of clinical and neuroradiological measures with reduced variability due to the increased sample size. The results indicate that the effects seen in the overall ITT population and MRI cohort were generally mirrored in the prespecified patient subgroups, with directionality uniformly in favor of DMF.
The integrated analysis was considered appropriate due to similarities between DEFINE and CONFIRM in terms of study design, patient baseline demographic and disease characteristics, treatment history, and treatment effects, but it was not without limitations. The P-values are only informational as they represent the variability in the estimated treatment effect rather than a formal test of superiority of DMF versus placebo. To provide pivotal evidence for an indication, the required degree of significance in the integrated analysis has to be judged on a case-by-case basis, considering factors such as amount of supportive data, differences in study design, and consistency between the findings of the individual studies. Despite the many similarities between the two studies, some noticeable differences include the different options for discontinuing study treatment and initiating treatment with an approved, open-label, alternative MS medication due to one or multiple confirmed relapses. In addition, the 12-week confirmed disability progression results were statistically significant in DEFINE but not in CONFIRM, although a clinically meaningful treatment effect on disability progression was observed in CONFIRM, with the 95% confidence interval overlapping with that from DEFINE. The difference in disability progression results between the studies may be related to the relatively low rate of disability progression in the placebo group in CONFIRM (17%) compared with DEFINE (27%). The subgroup analyses provide reduced variability with increased sample size compared with the individual studies. The 95% confidence intervals were provided to represent the variability in the treatment effect rather than statistical testing of efficacy. Numerous subgroup analyses of different endpoints, dose groups, and subgroup populations may lead to the multiplicity issue. The confidence interval for each subgroup varies in length due to the combination of variability and sample sizes of subgroups.
An integrated analysis of safety data from DEFINE and CONFIRM has also been conducted, but is beyond the scope of the present paper. A detailed examination of the integrated safety profile is available in a companion publication.
Conclusions
The integrated analysis suggests a substantial therapeutic benefit of DMF in the form of strong, consistent efficacy on clinical and neuroradiological outcomes. These effects are broadly consistent across diverse subgroups of patients with varied demographic and disease characteristics, suggesting that DMF may be an appropriate treatment choice for many people with RRMS.
Acknowledgments
Karyn M. Myers, Ph.D. (Biogen Idec) wrote the first draft of the paper based on input from authors, and Syeda Raji (Biogen Idec) provided graphic support. Biogen Idec reviewed and provided feedback on the paper to the authors. The authors had full editorial control of the paper and provided their final approval of all content.
Author Contributions
Dr. Fox: served on the steering committee, contributed to the conception and design of the study, participated as an investigator and collected data, interpreted the data, and reviewed the manuscript. Dr. Miller: contributed to the conception and design of the study, participated as an investigator and collected data, interpreted the data, and reviewed the manuscript. Dr. Bar-Or: served on the steering committee, contributed to the conception and design of the study, participated as an investigator and collected data, interpreted the data, and reviewed the manuscript. Dr. Phillips: served on the steering committee, contributed to the conception and design of the study, participated as an investigator and collected data, interpreted the data, and reviewed the manuscript. Dr. Arnold: served on the steering committee, contributed to the conception and design of the study, participated as an investigator and collected data, interpreted the data, and reviewed the manuscript. Dr. Selmaj: served on the steering committee, contributed to the conception and design of the study, participated as an investigator and collected data, interpreted the data, and reviewed the manuscript. Dr. Kita: served on the steering committee, contributed to the conception and design of the study, participated as an investigator and collected data, interpreted the data, and reviewed the manuscript. Dr. Hutchinson: served on the steering committee, contributed to the conception and design of the study, participated as an investigator and collected data, interpreted the data, and reviewed the manuscript. Ms. Yang: served on the steering committee, contributed to the conception and design of the study, analyzed the data, interpreted the data, and reviewed the manuscript. Dr. Zhang: analyzed and interpreted the data and reviewed the manuscript. Dr. Dawson: served on the steering committee, contributed to the conception and design of the study, interpreted the data, and reviewed the manuscript. Dr. Viglietta: interpreted the data and reviewed the manuscript. Dr. Sheikh: interpreted the data and reviewed the manuscript. Dr. Gold: served on the steering committee, contributed to the conception and design of the study, participated as an investigator and collected data, interpreted the data, and reviewed the manuscript.
Conflict of Interest
Dr. Fox: consultant fees from Actelion, Biogen Idec, MedDay, Novartis, Questcor, Teva, and Xenoport; served on advisory committees for Actelion, Biogen Idec and Novartis; research grant funding from Novartis. Dr. Miller: honoraria for consultancy, scientific advisory role or other activities from Biogen Idec, GlaxoSmithKline, Novartis, Merck, Chugai, Mitsubishi Pharma Europe and Bayer Schering Pharma; research support or grants from GlaxoSmithKline, Biogen Idec, Novartis and Merck; honoraria through payments to employer (UCL Institute of Neurology) for Advisory Committee and/or Consultancy advice in MS studies from Biogen Idec, GlaxoSmithKline, Novartis, Merck, Chugai, Mitsubishi Pharma Europe and Bayer Schering Pharma; compensation through payments to employer for performing central MRI analysis of MS trials from GlaxoSmithKline, Biogen Idec, Novartis and Merck; the NMR Research Unit at UCL Institute of Neurology is supported by the UK MS Society and UCL-UCLH Biomedical Research Centre. Dr. Bar-Or: honoraria and/or research support from Amplimmune, Aventis, Bayhill Therapeutics, Berlex, Biogen Idec, Diogenix, Eli-Lilly, EMD Serono, Genentech, GlaxoSmithKline, Medimmune, Novartis, Ono Pharma, Receptos, Roche, Sanofi Genzyme, and Teva Neuroscience. Dr. Phillips: consulting fees from Acorda, Biogen Idec, Genzyme, Merck Serono, and Sanofi; research support from Roche. Dr. Arnold: honoraria/revenue from Bayer HealthCare, Biogen Idec, Coronado Biosciences, Eli Lilly, EMD Serono, Genentech, Genzyme, NeuroRx Research, Novartis, Roche, and Teva; research support from Bayer HealthCare and Biogen Idec. Dr. Selmaj: compensation for consulting services from Genzyme, Novartis, Ono, Roche, Synthon, and Teva; compensation for speaking from Biogen Idec. Dr. Kita: served as PI on studies sponsored by Biogen Idec, Novartis, Acorda, and Serono; on the speaker's bureau for Biogen Idec; participated in advisory boards for Biogen Idec and Novartis. Honoraria and fees were paid directly to her employer and personal compensation was limited to travel/lodging reimbursement. Dr. Hutchinson: honoraria from Bayer Schering, Biogen Idec, Merck-Serono, and Novartis; editorial fees from the Multiple Sclerosis Journal; research grants from the Health Research Board, Ireland and Dystonia Ireland. Ms. Yang and Drs. Zhang, Dawson, Viglietta, and Sheikh: employees of Biogen Idec. Dr. Gold: honoraria from Bayer HealthCare, Biogen Idec, Merck Serono, Novartis, and Teva Neuroscience; research support from Bayer HealthCare, Biogen Idec, Merck Serono, Novartis, and Teva Neuroscience; compensation from Sage for serving as editor of Therapeutic Advances in Neurological Disorders.


