Formation of cadherin-expressing brain nuclei in diencephalic alar plate divisions
Abstract
During the formation of brain nuclei, the vertebrate neural tube is partitioned into distinct embryonic divisions. In this study, the expression of three members of the cadherin family of adhesion molecules (cadherin-6B, cadherin-7, and R-cadherin) was mapped to study the differentiation of gray matter in the divisions of the diencephalic alar plate of chicken embryos from embryonic day 3 (E3) to E10. At early stages of development (E3–E4), each cadherin is expressed in restricted regions of the diencephalic wall of the neural tube. The borders of some of the expression domains coincide with divisional boundaries. As the mantle layer is formed and increases in thickness from E4 to E8, morphologically discernible aggregates of cells appear that express the three cadherins differentially. These aggregates represent the anlagen of specific diencephalic brain nuclei, e.g., the lateroanterior nucleus, the ventral geniculate nucleus, the nucleus rotundus, the perirotundic area, the principal precommissural nucleus, and the lateral spiriform nucleus. Most of the cadherin-expressing diencephalic nuclei studied in this work apparently derive from a single embryonic division and remain there. The divisional boundaries are replaced gradually by the borders of cadherin-expressing brain nuclei. The current results support the idea that cadherins confer differential adhesiveness to developing structures of gray matter in the diencephalic alar plate. Moreover, they suggest that each cadherin plays a role in the formation of specific brain nuclei within the diencephalic divisions. J. Comp. Neurol. 421:461–480, 2000. © 2000 Wiley-Liss, Inc.
The vertebrate neural tube consists of an inner (ventricular) layer of proliferative cells and an outer (mantle) layer in which postmitotic neurons differentiate. The mantle layer greatly increases in thickness during development as more and more postmitotic neurons accumulate in it and begin to aggregate in morphologically distinct groups of early neurons. These aggregates develop into the morphologically and functionally diverse brain nuclei and cortical layers that constitute the gray matter of the mature brain.
Several lines of evidence indicate that, early in development, the embryonic vertebrate brain is divided into a number of independent morphogenetic fields in which proliferation and differentiation of neurons and glial cells take place. These embryonic fields divide the neural tube into separate longitudinal and transverse domains (Rendahl, 1924; Vaage, 1969; Keyser, 1972; Puelles et al., 1987, Puelles et al., 1991; Figdor and Stern, 1993). The spatial sequence and arrangement of the embryonic divisions, in general, are similar for most vertebrate species (Nieuwenhuys et al., 1998). Each embryonic division is characterized by the expression of specific gene regulatory proteins (Puelles and Rubenstein, 1993; Wilkinson, 1993; Shimamura et al., 1995; Shimamura and Rubenstein, 1997), adhesion molecules (Gänzler and Redies, 1995; Redies, 1995), or other molecular markers and gives rise to a defined set of gray matter structures. For example, the alar plate of the diencephalon consists of the pretectum (PT), the dorsal thalamus (DT), and the ventral thalamus (VT) in a caudal-to-rostral sequence [Keyser, 1972; Puelles et al., 1991; Puelles, 1995; alar plate of prosomeres 1–3 (p1–p3) after Puelles and Rubenstein, 1993]. The PT can be divided further into secondary subdivisions (Rendahl, 1924; Martínez-de-la-Torre, 1985; Caballero-Bleda et al., 1992; Figdor and Stern, 1993; Redies et al., 1997; De Castro et al., 1998).
In the current study, we map the expression of three cadherins, cadherin-6B (cad6B), cadherin-7 (cad7), and R-cadherin (Rcad), during the early development of the diencephalic alar plate in the chicken embryo (3–10 days of incubation; E3–E10). Expression of the cadherins at stages before E3 has been described previously (Gänzler and Redies, 1995; Nakagawa and Takeichi, 1995, Takeichi, 1998). Cadherins are a family of Ca2+-dependent, morphoregulatory adhesion molecules that mediate the aggregation of cells in a preferentially homotypic fashion (for reviews, see Redies and Takeichi, 1996; Koch et al., 1999). There are several subfamilies of cadherins (for review, see Suzuki, 1996). Most cadherins studied to date are expressed differentially in the developing vertebrate brain in a spatially restricted fashion (for review, see Redies, 2000). Typically, each cadherin is expressed by specific embryonic divisions of the vertebrate brain. Moreover, it has been shown that, in the hypothalamus of the chicken embryo, two cadherins, N-cadherin (Ncad) and Rcad, are expressed differentially by aggregates of neurons in the differentiating mantle layer from the beginning of the formation of the mantle layer (Gänzler and Redies, 1995). In the current study, we show that two other cadherins also are expressed differentially by the earliest anlagen of diencephalic brain nuclei. Thus, each of these cadherins can be used as a molecular marker for specific brain nuclei during their formation and differentiation. In addition, we describe how the formation of cadherin-positive diencephalic nuclei relates to the embryonic divisions of the chicken diencephalon. In the accompanying paper (Redies et al., 2000), cadherin expression in the entire diencephalon of the chicken is described in more detail for later stages of development (E11–E15), when most structures of gray matter already have been formed.
Abbreviations
-
- APR
-
perirotundic area
-
- cad6B
-
cadherin-6B
-
- cad7
-
cadherin-7
-
- CP
-
nucleus of the posterior commissure
-
- cp
-
posterior commissure
-
- DC
-
dorsal complex
-
- DT
-
dorsal thalamus
-
- DTav
-
dorsal thalamus, anteroventral subdivision
-
- EmT
-
eminentia thalami
-
- ET
-
epithalamus
-
- GT
-
griseum tectale
-
- GV
-
ventral geniculate nucleus
-
- HH
-
stage according to Hamburger and Hamilton (1951)
-
- III
-
oculomotor nucleus
-
- IPS
-
interstitial nucleus of the pretecto-subpretectal tract
-
- ITO
-
prospective interstitial nucleus of the optic tract
-
- LA
-
lateroanterior nucleus
-
- lfb
-
lateral forebrain bundle
-
- M
-
mamillary region of the hypothalamus
-
- Mes
-
mesencephalon
-
- os
-
optic stalk
-
- p1–p5
-
prosomeres 1–5
-
- PE
-
external pretectal nucleus
-
- PeM
-
perimamillary region of the hypothalamus
-
- PPC
-
principal precommissural nucleus
-
- PT
-
pretectum
-
- PTc
-
pretectum, commissural subdivision
-
- PTj
-
pretectum, juxtacommissural subdivision
-
- PTp
-
pretectum, precommissural subdivision
-
- PVA
-
periventricular area
-
- R
-
nucleus rotundus
-
- Rcad
-
R-cadherin
-
- Ri
-
nucleus rotundus, intermediate subdivision
-
- RM
-
retromamillary region of the hypothalamus
-
- Rpf
-
nucleus rotundus, parafascicular subdivision
-
- Rpl
-
nucleus rotundus, posterolateral subdivision
-
- Rpm
-
nucleus rotundus, posteromedial subdivision
-
- RR
-
retrorotundic area
-
- RS
-
superior reticular nucleus
-
- Sp
-
anlage of spiriform nuclei
-
- SpL
-
lateral spiriform nucleus
-
- SpM
-
medial spiriform nucleus
-
- SRt
-
subrotundic nucleus
-
- SS
-
superficial synencephalic nucleus
-
- Tect
-
optic tectum
-
- Tel
-
telencephalon
-
- thio
-
thionine stain
-
- VL
-
ventrolateral nucleus
-
- VT
-
ventral thalamus
-
- ZI
-
zona incerta
-
- zl
-
zona limitans intrathalamica
MATERIALS AND METHODS
Animals
Fertilized eggs from White Leghorn chicken (Gallus domesticus) were obtained from local farms and incubated at 65% humidity and 38°C in a forced-draft incubator (Ehret, Emmendingen, Germany). Embryos were cooled on ice to induce deep anesthesia. After removal from the egg, embryos were killed by decapitation, in accordance with national and institutional guidelines on the use of animals in research. Embryos were staged according to Hamburger and Hamilton (1951). Embryos at the following stages were used: stages 21, 24, and 27; stage 29 (6 days of incubation; E6.0); stage 30 (E6.5); stage 31 (E7.0); stage 32 (E7.5); stage 34 (E8.0); stage 35 (E9.0); and stage 36 (E10.0).
Antibodies
The following antibodies were used for immunostaining: mouse monoclonal antibodies CC6B-1 and CC7-1 raised against chicken cad6B and cad7, respectively (Nakagawa and Takeichi, 1998); rat monoclonal antibody NCD-2 (Hatta and Takeichi, 1986) raised against chicken Ncad; and mouse monoclonal antibody RCD-2 raised against chicken Rcad (Redies et al., 1992; Arndt and Redies, 1996). These antibodies were shown to react specifically with the respective molecules (for individual references, see above).
Immunohistochemistry
Immunostaining procedures were described in detail previously (Redies et al., 1993, Redies et al., 1997). Briefly, brains or whole heads from E3–E10 embryos were fixed in 4% formaldehyde dissolved in Hanks' balanced salt solution supplemented with 1 mM Ca2+ and 1 mM Mg2+ (HBSS) for 2 hours at 4°C. Specimens were then immersed in a graded series of sucrose solutions (12%-18% sucrose in HBSS), embedded in Tissue Tek optimum cutting temperature medium (Sakura, Torrance, CA), frozen in liquid nitrogen, and stored at −80°C.
Sections (16–20 μm thick) were cut on a refrigerated microtome, mounted on coated glass slides, dried, and stored at −20°C. Several complete series of horizontal and transverse sections were obtained through entire brains for each stage analyzed. Consecutive sections were stained with the antibodies listed above. For each antibody, sections within the set of immunostains were spaced 80–100 μm apart.
Peroxidase immunohistochemistry was carried out by using a commercially available kit (Vectastain Elite ABC kit; Vector Laboratories, Burlingame, CA), as described previously (Redies et al., 1997). Sections were postfixed for 10 minutes in ice-cold 4% formaldehyde/HBSS and washed in Tris-buffered saline, pH 7.4, containing 1mM CaCl2 (TBS). To block unspecific binding and to dilute antibodies, 1.5% horse serum in TBS was used. Primary antibodies were applied for 1.5 hours at room temperature or overnight at 4°C. After sequential incubation with appropriate biotinylated secondary antibodies and avidin-coupled peroxidase complex, sections were treated with a substrate solution containing 0.7% 3-3′ diaminobenzidine tetrachloride, 0.5% nickel chloride, and 0.1% peroxide in TBS. After enough reaction product had formed, sections were washed, dehydrated, and embedded in Histomount (Shandon, Frankfurt, Germany).
For neuroanatomic orientation, sections adjacent to those used for immunohistochemistry were stained with thionine acetate for Nissl substance, as described previously (Redies et al., 1993). All stains shown in the figures are brightfield photomicrographs. Photographic images of sections selected for the figures were scanned by using a computer-based image processing system and labeled with the Freehand (Macromedia, San Francisco, CA) and Photoshop (Adobe Systems, San Jose, CA) image-processing programs.
Data analysis and terminology
The prosomeric model of the vertebrate brain by Puelles and Rubenstein (1993) served as the basis to identify neuromeric divisions. In addition, to identify gray matter derivatives of the divisions, the seminal study by Rendahl (1924) and several more recent publications on the development of the chicken diencephalon (Martínez-de-la-Torre, 1985; Puelles et al., 1987, Puelles et al., 1991; De Castro et al., 1998) were consulted.
RESULTS
Overview and general observations
Figures 1 and 2 show wholemount specimens of the chicken diencephalon for stage 21 (Fig. 1A,B), stage 24 (Fig. 1C,D), and stage 31 (Fig. 2) viewed from the ventricular surface. These specimens were immunostained for cad6B and cad7. Similar wholemount preparations stained for Rcad were published previously (Gänzler and Redies, 1995). Due to the limitations of antibody penetration, the wholemount specimens show only staining of the ventricular surface and the innermost ventricular layer. To also observe cadherin expression in the mantle layer of the diencephalic alar plate, series of horizontal and transverse sections were immunostained with cad6B, cad7, and Rcad. Figures 3-10 show overviews of cadherin expression in horizontal sections for six stages of development (stages 21, 24, 27, 29, 31, and 36). An attempt was made to show sections at roughly similar levels of sectioning. Each figure displays adjacent sections immunostained for cad6B, cad7, Rcad, and a thionine (Nissl) stain (thio). For each figure, schematic diagrams of the embryonic divisions and structures of gray matter are shown at the bottom of the figures (Figs. 3-6, 8, 10) or in separate figures (Figs. 7, 9). Selected brain regions are shown at a higher magnification in Figures 11-14. A general summary of the expression patterns is given in Figure 15.

A–D: Wholemount specimens immunostained with antibodies against cadherin-6B (cad6B; A,C) and cadherin-7 (cad7; B,D). A and B show the diencephalon at embryonic day 3 (E3; stage 21). C and D show the diencephalon at E4 (stage 24). Views onto the ventricular surface of half of the brain are shown in which the dark reaction product indicates cadherin expression in the ependymal and ventricular layers. The lines in A and C indicate the approximate levels of sectioning for the horizontal sections shown in Figures 3 and 4, respectively. The arrows in B and D indicate the cad7-positive part of the zona limitans (zl). For other abbreviations, see list. Scale bars = 160 μm in B (also applies to A), 170 μm in D (also applies to C).

Wholemount specimens of the diencephalon at E7 (stage 31) that were immunostained with antibodies against cad6B (A) and cad7 (B). Views onto the ventricular surface of half of the brain are shown in which the dark reaction product indicates cadherin expression in the ependymal and ventricular layers. The line in A indicates the approximate level of sectioning for the horizontal sections shown in Figure 8. The arrows in B indicate the cad7-positive parts of the zona limitans (zl). For other abbreviations, see list. Scale bar = 200 μm.

Cadherin expression in adjacent horizontal sections through the E3 (stage 21) diencephalic alar plate immunostained with antibodies against cad6B (A), cad7 (B), and R-cadherin (Rcad; C). Also shown are a thionine (thio) stain of an adjacent section (D) and a schematic diagram showing the postulated diencephalic divisions (E). The vertical lines above the ventricular lining indicate the positions of the postulated divisional borders. For other abbreviations, see list. Scale bar = 40 μm.

Cadherin expression in adjacent horizontal sections through the E4 (stage 24) diencephalic alar plate immunostained with antibodies against cad6B (A), cad7 (B), and Rcad (C). Also shown are a thionine (thio) stain of an adjacent section (D) and a schematic diagram showing the postulated diencephalic divisions (E). The vertical lines above the ventricular lining indicate the position of the postulated divisional borders. For abbreviations, see list. Scale bar = 100 μm.

Cadherin expression in adjacent horizontal sections through the E5 (stage 27) diencephalic alar plate immunostained with antibodies against cad6B (A), cad7 (B), and Rcad (C). Also shown are a thionine (thio) stain of an adjacent section (D) and a schematic diagram showing the postulated diencephalic divisions (E). The vertical lines above the ventricular lining indicate the position of the postulated divisional borders. The asterisks in B and C indicate artifacts. The arrows in A indicate cad6-positive cells of the prospective external pretectal nucleus. For abbreviations, see list. Scale bar = 80 μm.

Cadherin expression in adjacent horizontal sections through the E6 (stage 29) diencephalic alar plate immunostained with antibodies against cad6B (A), cad7 (B), and Rcad (C) and a thionine (thio) stain of an adjacent section (D). A schematic diagram of the postulated diencephalic divisions is shown in Figure 7. The vertical lines above the ventricular lining indicate the position of the postulated divisional borders. The arrows in A indicate cad6-positive cells of the prospective external pretectal nucleus. For abbreviations, see list. Scale bar = 100 μm.
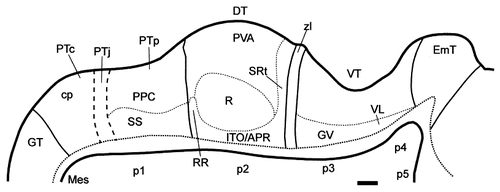
Schematic diagram showing the postulated diencephalic divisions at stage 29 (E6) for the sections displayed in Figure 6. For abbreviations, see list. Scale bar = 100 μm.

Cadherin expression in adjacent horizontal sections through the E7 (stage 31) diencephalic alar plate immunostained with antibodies against cad6B (A), cad7 (B), and Rcad (C) and a thionine (thio) stain of an adjacent section (D). A schematic diagram of the postulated diencephalic divisions is shown in Figure 9. The vertical lines above the ventricular lining indicate the position of the postulated divisional borders. The asterisk in D indicates an artifact. For abbreviations, see list. Scale bar = 250 μm.
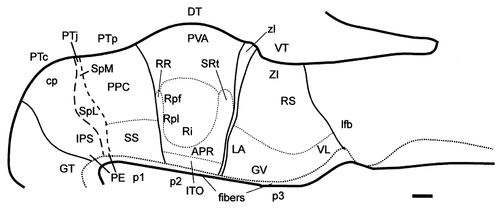
Schematic diagram showing the postulated diencephalic divisions at stage 31 (E7) for the sections displayed in Figure 8. For abbreviations, see list. Scale bar = 250 μm.
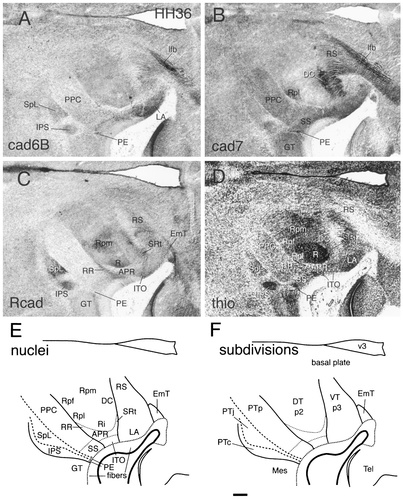
Cadherin expression in adjacent horizontal sections through the E10 (stage 36) diencephalic alar plate immunostained with antibodies against cad6B (A), cad7 (B), and Rcad (C) and a thionine (thio) stain of an adjacent section (D). Schematic diagrams of the postulated diencephalic divisions are shown in E,F. For abbreviations, see list (abbreviations are for gray matter structures in E and for embryonic divisions in F). Scale bar = 200 μm.
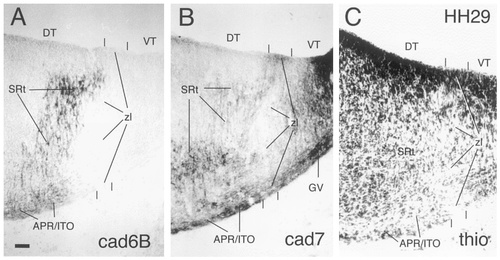
Cadherin expression around the zona limitans intrathalamica at E6 (stage 29). Adjacent horizontal sections were stained with antibodies against cad6B (A), cad7 (B), and with thionine (C). The vertical lines at the brain surface indicate the borders of the zona limitans. For abbreviations, see list. Scale bar = 40 μm.
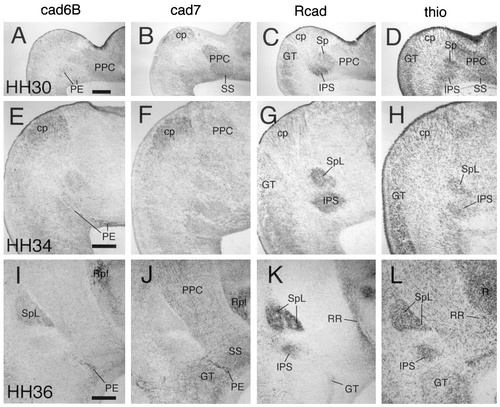
Cadherin expression in the pretectum at E6.5 (stage 30; A–D), E8 (stage 34; E–H), and E10 (stage 36; I–L). Horizontal sections were immunostained with antibodies against cad6B (A,E,I), cad7 (B,F,J), and Rcad (C,G,K) or with thionine (D,H,L). Results shown in A–D, E–H, and I–L are from adjacent sections, respectively. For abbreviations, see list. Scale bars = 200 μm in A (also applies to B–D), E (also applies to F–H), and I (also applies to J–L).
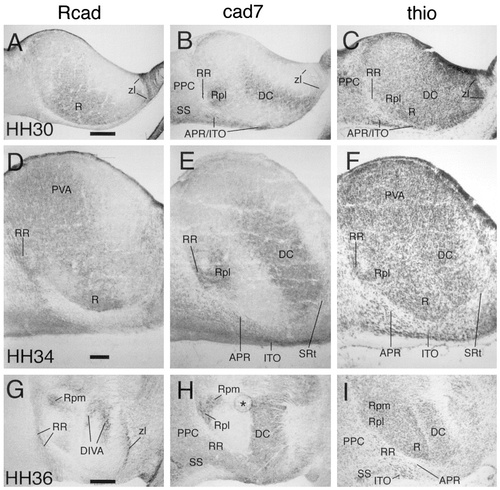
Cadherin expression in the dorsal thalamic region at E6.5 (stage 30; A–C), E8 (stage 34; D–F), and E10 (stage 36; G–I). Horizontal sections were immunostained with antibodies against Rcad (A,D,G) and cad7 (B,E,H) or with thionine (C,F,I). Results shown in A–C, D–F, and G–I are from adjacent sections, respectively. The asterisk in H indicates an artifact. For abbreviations, see list. Scale bars = 200 μm in A (also applies to B,C) and G (also applies to H,I); 100 μm in D (also applies to E,F)
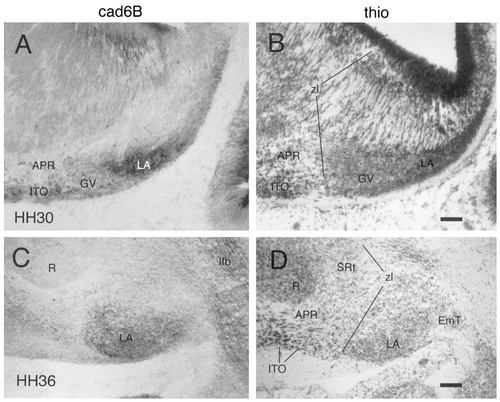
Cad6B expression in the region of the lateroanterior nucleus (LA) at E6.5 (stage 30; A,B) and at E10 (stage 36; C,D). Horizontal sections stained with thionine (B,D) are adjacent to the immunostained sections shown in A and C. For other abbreviations, see list. Scale bars = 100 μm in B (also applies to A) and D (also applies to C).
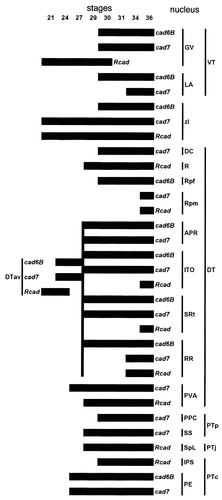
Summary of cadherin expression by the diencephalic nuclei examined in this study. The bars indicate expression of cad6B, cad7, and Rcad, as indicated. The stages of development are given at the top of the figure (stages 21–36). Nuclei and embryonic divisions are indicated on the right. Note that the anteroventral subdivision of DT (DTav) gives rise to the perirotundic area (APR), the interstitial nucleus of the optic tract (ITO), the subrotundic nucleus (SRt), and the retrorotundic area (RR). For other abbreviations, see list.
Each of the three cadherins is expressed in a restricted fashion at all stages examined in the current study (stages 21–36; E3–E10). The expression patterns of the cadherins differ from one another, but partial overlap is observed. At the earliest stages examined (stage 21 and 24), the cadherins are expressed in some brain regions from the ventricular surface to the pial surface. In other regions, immunoreactivity largely is restricted to areas of mantle layer. The borders of cadherin expression generally colocalize with known divisional boundaries. For example, the boundary region between the VT and the DT, the zona limitans intrathalamica, is marked by the expression of cad6B on the DT side (zl; Figs. 1A,C, 3A, 4A) and by the expression of cad7 and Rcad on the VT side (Figs. 1B,D, 3B,C, 4B,C). The zona limitans itself expresses cad7 and Rcad but not cad6B. At stage 31, cad7 expression in the zona limitans clearly delineates the ventrally diverging borders of this landmark (Fig. 2B, arrows), leaving unstained the central core and two parallel lines at the interfaces with the DT and the VT. Observations at earlier stages suggest that cad7 expression appears first at the rostral border of the zona limitans (Fig. 1B,D, arrows) and only later turns up at the caudal border (Fig. 2B). The cad7-positive staining of the rostral border of the zona limitans extends as a line into the perimamillary region of the hypothalamic basal plate, passing obliquely across the retromamillary area (PeM and RM in Fig. 1B).
From around stage 24, three additional (secondary) subdivisions can be detected in the PT by their cadherin expression profile. These subdivisions are termed commissural, juxtacommissural, and precommissural, denoting their location relative to the posterior commissure (Figs. 4, 5, 7). This divisional scheme has been proposed before for avian species and for other species (Martínez-de-la-Torre, 1985; Puelles et al., 1996; Redies et al., 1997; De Castro et al., 1998; Pombal and Puelles, 1999; see discussion in Redies, 2000).
Differential expression of cadherins in the mantle layer begins, in some cases, at the earliest stages of the formation of the mantle layer (see, e.g., Rcad expression in the DT and the VT; Fig. 3C). In other cases, cadherin immunoreactivity is observed first when different laminae have formed in the mantle layer (see, e.g., DT at stage 27; Fig. 5A–C). In many cases, the anlagen of the diencephalic brain nuclei (pronuclei) also express specific cadherins. For example, the ventral geniculate nucleus expresses Rcad during its early development (GV in Figs. 3C, 4C, 5C, 6C), the anteroventral region of the DT and its derivative nuclei (Rendahl, 1924; Puelles et al., 1991) express cad6B (DTav and SRt in Figs. 5A, 6A), the superficial synencephalic nucleus expresses cad7 (SS in Figs. 5B, 6B, 8B, 10B), and the lateral spiriform nucleus expresses Rcad (SpL in Figs. 8C, 10C). In general, the cadherin-positive brain nuclei develop within the limits of the division in which they assume their final position. In the paragraphs below, the major features of cadherin expression are described in chronological order, focusing on the formation of a subset of particularly prominent brain nuclei that express one or more of the cadherins mapped in this study.
Stage 21
At stage 21 of development, the telencephalic, diencephalic, and mesencephalic portions of the neural tube can be identified clearly (Fig. 3). In the diencephalon, a relatively thin mantle layer of loosely arranged cells can be distinguished from a more densely packed ventricular layer. The three main divisions of the diencephalic alar plate, i.e., the PT, the DT, and the VT, are separated by small ridges on the ventricular surface. In addition, the VT and DT are separated by the zona limitans region (Rendahl, 1924; Vaage, 1969; Puelles et al., 1987, Puelles et al., 1991; Puelles and Rubenstein, 1993).
The PT shows cad7 immunoreactivity in the region of the posterior commissure in wholemount specimens (cp in Figs. 1B). There are also cad7-positive cells in the superficial pretectal mantle layer (Fig. 3B). A few scattered, superficial, Rcad-positive cells also are found. In the DT, the ventral half of the ventricular surface shows strong cad6B immunoreactivity (Figs. 1A, 3A). Caudally, this immunoreactivity decreases toward the border with the PT. Rostrally, there is a sharp limit of ventricular cad6B expression at the border with the region of the zona limitans (Fig. 3A). A similar staining pattern, although it is weaker, also is seen in the mantle layer. Rcad-positive cells extending neurites in a caudal direction into the PT are found in the most superficial layer of the mantle layer of the DT (Fig. 3C), where there also is faint cad7 expression (Fig. 3B). The zona limitans expresses cad7 and Rcad predominantly at its ventricular surface (Fig. 3B,C). In the VT, cad7 expression is strong throughout the wall of the neural tube except at the area abutting the zona limitans. There are sharp limits of cad7 expression at the prospective area traversed by the lateral forebrain bundle and at border to the thalamic eminence (lfb and EmT, respectively, in Figs. 1B, 3B). A few Rcad-positive cells are observed in the thin mantle layer at a position where the ventral geniculate nucleus is forming (GV in Fig. 3C). The ventricular surface of the thalamic eminence also expresses Rcad and cad6B, which both seem to diminish gradually into the VT (Figs. 1A, 3A,C).
Stage 24
The mantle layer has slightly increased in thickness (Fig. 4). The three subdivisions of the PT (commissural, juxtacommissural, and precommissural) start to become distinguishable on histologic grounds (Fig. 4D) and by their cadherin expression. The commissural subdivision contains cad7-positive fibers and cells and fibers that express Rcad (PTc in Fig. 4B,C). The juxtacommissural subdivision is characterized by periventricular cad6B expression (Fig. 4A). The precommissural subdivision fills the space between the juxtacommissural subdivision and the DT, which shows strong cad6B immunoreactivity and some cad7 staining in the mantle layer (PTp and DT in Fig. 4A,B). At the caudal border of the PT, expression changes at the ventricular surface from Rcad in the PT to cad7 in the griseum tectale of the mesencephalon (Fig. 4B,C). Cadherin immunostaining in the DT and the VT has changed little from the previous stage (Fig. 1). Cad6B expression in the DT clearly predominates in its anteroventral part (Figs. 1C, 4A). A subpial layer of fibers positive for cad6B or cad7 appears (Fig. 4A,B).
Stage 27
The mantle layer has increased in thickness considerably, especially in the DT, and superficial strata start to appear in the three diencephalic prosomeres. The anlagen of several brain nuclei become discernible. As a consequence of the differential growth in the different embryonic divisions, the ventricular surface begins to show several recesses and bulges (Fig. 5D). The three prosomeric divisions are delineated clearly by changes in histologic features and by their cadherin expression.
The pretectal subdivisions are seen best by means of the cad7 immunostaining (Fig. 5B). The commissural subdivision is marked by the thick fiber fascicles of the posterior commissure that express cad7 (cp in Fig. 5B). The juxtacommissural PT shows weak and diffuse cad7 immunoreactivity in the mantle layer jointly with weak cad6B reactivity in the anlage of the external pretectal nucleus (Fig. 5A, arrows). The mantle layer of the precommissural subdivision does not express cad7 except for a layer of strongly cad7-positive cells and fibers superficial to the anlage of the superficial synencephalic nucleus (SS in Fig. 5B,D,E).
The entire ventricular lining of the DT displays cad6B staining. There also is some Rcad immunoreactivity in the caudal ventricular lining, as described previously (area R8 in Gänzler and Redies, 1995), and some cad7 staining rostrally adjacent to the Rcad-positive lining (Fig. 5A–C). In the mantle layer, a stream of cad6B-positive cells with radially oriented neurites is found rostrally, immediately adjacent to the DT/VT boundary. This group of cells extends superficially in a caudal direction up to the PT/DT border and represents a distinct and coherent anteroventral subdivision of the DT (DTav in Fig. 5A; Rendahl, 1924; Puelles et al., 1991; see discussion in Redies et al., 2000). Part of this subdivision also expresses cad7. An enlargement of this area at stage 29 is shown at a higher magnification in Figure 11. Deep to the early nucleus rotundus (R in Fig. 5E), the mantle layer contains a relatively large periventricular region that expresses cad7 (PVA in Fig. 5B,E).
The VT is dominated by cad7 staining extending from the ventricular surface to the pial surface in all regions (Fig. 5B), except for a thin stripe that is adjacent rostrally to the cad7-positive zona limitans and expands ventrally rostralward. This stripe is visible on the wholemount immunostains at stages 24 and 31 (Figs. 1D, 2B). Rostrally, cad7 expression diminishes at the border to the thalamic eminence (prosomere 4 after Puelles and Rubenstein, 1993). In the mantle layer, a distinct superficial lamina of cells has emerged. The caudal part of this lamina represents the early ventral geniculate nucleus (GV in Fig. 5B,E) and contains cells expressing Rcad and cad7. The Rcad-positive cells stop just in front of the zona limitans. Cells in the rostral part represent the early ventrolateral nucleus and express cad7 but not Rcad (VL in Fig. 5B,E). There also are cad7-positive fibers under the pial surface, probably representing the geniculate descending tract.
Stage 29
The border between the PT and the mesencephalon is marked by a drop in cad7 expression in the mantle layer as the cad7-positive griseum tectale of the midbrain ends (GT in Fig. 6B). The cad7-positive posterior commissural fibers are aggregated periventricularly in the commissural PT (PTc in Fig. 6B). In the precommissural subdivision, the anlage of the superficial synencephalic nucleus at the most superficial layer expressing cad7 is still cell-sparse (SS in Fig. 6B,D), whereas a deeper layer of more densely packed cells does not express any of the three cadherins. This deeper layer contains the anlage of the principal precommissural nucleus (PPC in Fig. 6B,D).
In the DT, the cad6B/cad7-positive anteroventral subdivision extends from the periventricular region caudally adjacent to the zona limitans to the surface, where it engulfs the nucleus rotundus laterally. Rostrally, the anteroventral subdivision has given rise to the cad6B-positive subrotundic nucleus (SRt in Figs. 6A,B,D,E, 11A). Superficially, it gives rise to the common anlage of the perirotundic area (APR) and to the prospective interstitial nucleus of the optic tract (ITO); both areas express cad6B and cad7 (APR/ITO in Figs. 6A,B,D,E, 11). Caudally, the cad6B-positive retrorotundic region (RR) originates from the most caudally migrated cells of the anteroventral subdivision. Some cad6B-positive fibers extend below the pial surface from this subdivision into the PT. The nucleus rotundus has a superficial subregion that expresses cad7 that is thicker caudally (Fig. 6B). Parts of the Rcad-positive periventricular region also show cad7 immunoreactivity.
In the superficial stratum of the VT, the anlage of the ventral geniculate nucleus has split into two sublaminae. The superficial sublamina expresses cad6B and cad7, whereas the deep sublamina is negative for both cadherins. Both sublaminae are weakly Rcad-positive (GV in Figs. 6, 7). The rostral part of the VT forming the ventrolateral nucleus retains its strong cad7 staining, which assumes a fibrous appearance deep to the superficial cell layer, suggesting that the cells translocate from a deeper position to a more superficial position relative to this fiber sheet (compare Fig. 5B with Fig. 6B). Alternatively, the fibrous staining may represent radial glial immunoreactivity. The cad7-negative stripe rostrally adjacent to the zona limitans has widened.
Stages 30–36
Overviews of immunostaining results for the diencephalic alar plate at stage 31 are shown in Figures 8 and 9 and at stage 36 in Figure 10. With the increase in thickness of the diencephalic alar plate from stage 21 to stage 36, the mantle layer differentiates into aggregates of neurons representing early brain nuclei. The nuclei appear at different stages of development. At stage 31, all nuclei examined in the current study are distinct morphologically and assume topologic positions similar to those observed in the mature brain (Figs. 8D, 9, 10D–F).
PT.
The pretectum (for overviews, see Figs. 8-10) is shown at a higher magnification in Figure 12 for stages 30, 34, and 36. In the commissural PT, the interstitial nucleus of the pretectosubpretectal tract can be observed to express Rcad from about stage 30 (IPS in Figs. 8C, 10C, 12C,G,K). A similar expression also is seen in the principal pretectal nucleus and the subpretectal nucleus, which jointly originate from the same pronucleus (data not shown). All three nuclei also express Ncad (Redies et al., 1993; see also Redies et al., 2000) but neither cad6B nor cad7. In the juxtacommissural PT, the spiriform nuclei become distinct morphologically at around stage 30. At the same time, they can be observed to express cadherins differentially. The lateral spiriform nucleus is located rostrally adjacent to the interstitial nucleus of the pretectosubpretectal tract and expresses Rcad but not cad6B or cad7 (SpL in Figs. 8C, 10C, 12G,K). Expression is relatively weak at stage 30 and gradually becomes stronger up to stage 36. The medial spiriform nucleus expresses cad7 but neither cad6B nor Rcad (data not shown). Cad6B is expressed by individual cells in both the commissural and juxtacommissural subdivisions from around stage 27 (Figs. 5A). At stages 29, 30, and 31, these cells are scattered throughout the two subdivisions and surround the interstitial nucleus of the pretectosubpretectal tract (Fig. 6A, arrows; PE in Figs. 8A, 12A). Later, the cells condense superficially in the external pretectal nucleus (PE in Figs. 10A, 12E,I). Note that the superficial representation of the commissural and juxtacommissural subdivisions is relatively narrow compared with their deeper portions at stage 36 (Fig. 10E,F).
In the precommissural subdivision, the principal precommissural nucleus, which does not express any of the cadherins at stage 29 (PPC in Fig. 6), shows gradually increasing levels of cad7 expression from stage 30 to stage 36. At stages 30 and 31, this expression is more prominent caudally (Figs. 8B, 12B), but it fills the entire area of the nucleus with apparently less intensity at stages 34 and 36 (Figs. 10B, 12F,J). The superficial synencephalic nucleus also moderately expresses cad7 (SS in Figs. 8B, 10B, 12B,F,J), but expression sets in earlier, as described above. Cad6B and Rcad expression is conspicuously absent from most of the mantle layer of the precommissural PT (Figs. 8C, 10C, 12G,K).
DT.
The DT (for overviews, see Figs. 8-10) is shown at a higher magnification in Figure 13 for stages 30, 31, and 36. The cad7-positive cells of the APR and ITO begin to separate from one another. The ITO cells form a relatively dense band of cells superficial to the less cell-dense APR. Note that most ITO cells remain within the limits of the DT, although a few cells may have extended into the most superficial part of the rostral PT. As a result of the increased growth of the adjacent divisions, the ITO becomes compressed rostrally by the lateroanterior nucleus and the ventral geniculate nucleus (LA and GV, respectively, in Fig. 10A,C) and caudally by the superficial synencephalic nucleus (SS in Fig. 10B,D; see Puelles et al., 1991). At stage 36, the different parts of the anteroventral subdivision can be distinguished by their Rcad expression. The APR shows no Rcad immunoreactivity, but the rostral and caudal extensions around the nucleus rotundus (SRt and RR, respectively) and the ITO have become Rcad positive (Figs. 10C, 13D,G). Rostral to SRt, parts of the lateral forebrain bundle differentially express cad6B and cad7 (Figs. 8A,B, 10A,B).
At stages 31–36, subregions within the nucleus rotundus (Martínez-de-la-Torre et al., 1990) can be discerned clearly by their cadherin expression profile (Figs. 8, 10, 13). This differential expression starts to appear already at stage 29 (Fig. 6). Cad6B is expressed in a parafascicular portion of the nucleus rotundus (Rpf in Fig. 8A), whereas the posterolateral portion expresses cad7 (Rpl in Figs. 8B, 10B). The intermediate and posteromedial portions express Rcad (Ri and Rpm in Figs. 8C, 10C).
At stage 31, the periventricular area appears at the same horizontal level as the nucleus rotundus and continues to express cad7 and Rcad in its different subregions (Fig. 8B,C). At stage 36, the nucleus rotundus is displaced ventrolaterally with respect to the periventricular area, and the two regions can no longer be seen at the same horizontal level of sectioning (Fig. 10D). At stage 36, the periventricular area (not shown in Fig. 10) has differentiated into a cad7-positive nucleus ovoidalis that is surrounded by Rcad-expressing regions (see Redies et al., 2000).
VT.
The ventral geniculate nucleus (GV in Fig. 8) continues to express cad7 but no longer shows cad6B or Rcad immunoreactivity. Dorsal to this nucleus, a cad6B-positive nuclear mass has appeared at stage 30 at the topologic position of the lateroanterior nucleus (LA in Fig. 14). This nucleus has increased in size considerably at stage 36 (Figs. 10, 14) and also expresses cad7 but not Rcad at this stage (Fig. 10B,C). It is located beneath the pial surface and rostrally abuts the dorsal part of the zona limitans (zl in Fig. 14). The cad7-positive fibers that cross the DT/VT boundary are part of the lateral forebrain bundle (lfb in Figs. 8B, 10B). On the thionine stain, the DT/VT boundary is marked by a change in cell density. The fibers of the lateral forebrain bundle cross through the intermediate cellular stratum of the VT that forms the anlage of the reticular nucleus. This nucleus strongly expresses cad7 (RS in Figs. 8B,D, 9, 10B,D,E). The dense cad7-positive periventricular stratum of the VT constitutes the avian zona incerta (ZI in Figs. 8B,D, 9).
DISCUSSION
The current results demonstrate that three cadherins (cad6B, cad7, and Rcad) are expressed in a spatially restricted manner during the development of the diencephalic alar plate of the chicken embryo. Similarly restricted expression patterns in areas of differentiating gray matter have been reported for several other cadherins in the chicken, mouse, frog, and zebrafish CNS (Espeseth et al., 1995; Gänzler and Redies, 1995; Matsunami and Takeichi, 1995; Redies and Takeichi, 1996; Korematsu and Redies, 1997; Liu et al., 1999; for review, see Redies, 2000). Together, these results suggest that cadherins are expressed by two types of cells in the developing CNS. First, cadherins are expressed by neuroepithelial cells and/or radial glial cells and their processes. With the exception of Ncad, this expression is restricted to specific embryonic divisions for each cadherin. Second, early differentiating neurons show differential cadherin expression in the mantle layer where they form the anlagen of brain nuclei. The paragraphs below discuss how the expression of cadherins by the two cell types relates to the embryonic divisions and developing brain nuclei of the diencephalic alar plate in the chicken embryo.
Expression and possible role of cadherins in diencephalic divisions
In the current study, we demonstrate that the expression of each cadherin in the ventricular layer relates to known diencephalic alar plate divisions. In some cases, cadherin expression is most prominent in the ependymal lining (e.g., cad6B expression in the DT), whereas, in other cases, cadherin expression is observed throughout the entire thickness of the neural tube wall (e.g., cad7 expression in the VT). In the latter case, the fibrous staining pattern extending from the ventricular lining to the pial surface suggests that the staining is associated with radial glial cells and their processes. Borders of expression that are formed by radial glial fibers and coincide with divisional borders also have been described for Rcad (Gänzler and Redies, 1995; Matsunami and Takeichi, 1995; Redies and Takeichi, 1996). At early stages of development, the divisional borders are marked by small ventricular ridges. The positions of the borders generally do not coincide with the ventricular sulci that appear later during development (Puelles and Rubenstein, 1993).
The boundary region between the DT and the VT, the zona limitans intrathalamica, represents an especially prominent divisional border within the diencephalic alar plate. The differential expression of cadherins around the zona limitans, therefore, was of particular interest to us. Adjacent to the zona limitans, a stream of cad6B-positive migratory cells is found on the dorsal thalamic side (Fig. 14). These cells likely represent the prospective superficial magnocellular nucleus of Rendahl (1924) and constitute the anteroventral histogenetic area, as studied in detail by Puelles et al. (1991) and described in the accompanying paper (Redies et al., 2000). It corresponds to the cell stream highlighted by the expression of Sox21 and Sox14 (Uchikawa et al., 1999) and of the expression of Nkx2.2 (Puelles et al., 1999). It is noteworthy that Sox21 also is expressed by the neuroepithelium of the DT (Uchikawa et al., 1999), which is also the case for cad6B (Fig. 4A). The anteroventral stream contrasts with the main mass of the dorsal thalamic mantle layer, which expresses cad7 and the gene Sox2 (Uchikawa et al., 1999), although cad7 only seems to appear in a subset of cells that expresses Sox2.
The zona limitans itself expresses Rcad (in the core, which also expresses Shh and Sim1; L.P., unpublished observations) and cad7 (in the shell-like slopes, coinciding with the expression of Nkx2.2; Shimamura et al., 1995; Puelles et al., 1999). Rostrally, a narrow stripe of the VT adjacent to the zona limitans shows weak cad7 expression, whereas there is strong expression in the rest of the VT. These results were confirmed by the wholemount immunostaining results (Figs. 1, 2) and demonstrate that the zona limitans is characterized by several changes in cadherin expression indicative of potential changes in adhesiveness at this boundary region. The cadherins may be activated downstream of the respective combinations of the gene regulatory proteins mentioned above.
The borders between some of the other embryonic divisions, e.g., between the secondary subdivisions of the PT, are demarcated less strictly by cadherin expression in the ventricular zone at early stages, although cad7 appears in a boomerang-shaped domain that approximates the p1 alar/basal limit and the p1/p2 limit (Figs. 1, 2). The p1/p2 limit also is underlined by the absence of cad6B staining at stages 21–24 (Figs. 3A, 4A). Relatively prominent changes in pretectal cadherin expression are seen in the mantle layer starting at around stage 27.
Based on their cadherin expression profile and histologic differentiation, we identified three secondary subdivisions in the PT along the rostrocaudal axis (commissural, juxtacommissural, and precommissural subregions). This subdivision scheme was demonstrated previously in the chicken and the frog (Rendahl, 1924; Martínez-de-la-Torre, 1985; Puelles et al., 1996; Redies et al., 1997; De Castro et al., 1998; for a description of the PT in other species, see Caballero-Bleda et al., 1992; Medina et al., 1993; Medina and Reiner, 1994). A similar temporal and spatial coincidence between cadherin expression and morphologic differentiation also is observed in the DT and is described in more detail in the accompanying paper (Redies et al., 2000). Like the primary divisions (prosomeres), the secondary subdivisions are characterized by changes in cadherin expression at their borders.
It has been suggested that cadherin-mediated changes of potential adhesiveness restrict the mixing of cells across established divisional boundaries in the embryonic brain (Gänzler and Redies, 1995; Matsunami and Takeichi, 1995; Redies and Takeichi, 1996). This idea has been supported by experimental data demonstrating a role for F-cadherin in localizing cells to specific neuroepithelial domains in the Xenopus embryo (Espeseth et al., 1998). In cell culture, the sorting of primary cells originating from neighboring brain divisions also has been linked to the differential expression of cadherins (Inoue et al., 1997; Stoykova et al., 1997; Wizenmann and Lumsden, 1997). In the chicken diencephalic alar plate, mixing of neuroepithelial cells was shown to be restricted at the primary divisional boundaries (DT/VT and DT/PT borders). There also is some tangential spread of cell clones in the mantle zone of the chicken diencephalon, as reported by Golden et al. (1997), but this tangential migration was not studied in relation to the diencephalic divisional borders. The current study includes at least one example of extensive tangential migration, i.e., by the cells of the anteroventral subdivision of the DT (DTav in Figs. 4C, 5; Rendahl, 1924; Puelles et al., 1991, Puelles et al., 1999; Uchikawa et al., 1999). Here, a subset of nuclei that express cad6B and cad7 originates from a narrow region caudally adjacent to the zona limitans (Figs. 14, 15; see Redies et al., 2000). This cell population disperses widely below the surface, and, for the most part, it remains within the DT.
Formation of brain nuclei
In general, the regional expression of cadherins in the mantle layer becomes a prominent feature with the onset of its marked growth in thickness and histologic differentiation. At this time of development, the anlagen of diencephalic brain nuclei are formed. Results from the current study on the expression of cadherins can be related to the development of specific brain nuclei or groups of brain nuclei, as shown previously for other cadherins (Gänzler and Redies, 1995; Korematsu and Redies, 1997; Korematsu et al., 1998; Liu et al., 1999). Roughly speaking, brain nuclei seem to be formed in two ways:
1) Accumulation of neurons in the mantle layer and morphologic differentiation take place at about the same time. In this case, the anlagen of the nuclei are visible morphologically during the initial growth of the nuclei. Examples are found in the prospective superficial laminae of the VT and DT. Here, the differential expression of cadherins already is observed in the earliest anlagen of brain nuclei, e.g., in the ventral geniculate nucleus at stage 21 (Fig. 3C), in the lateroanterior nucleus at stage 30 (Fig. 13A), and in the common anlage of the nuclei derived from the anteroventral subdivision at stage 27 (Fig. 5A,B). At the zona limitans boundary (Fig. 14), the borders of these developing anlagen coincide sharply with the divisional borders.
2) Morphological differentiation follows the initial growth of the mantle layer. For example, the intermediate laminae of the PT and the DT already have attained considerable thickness between stages 27 and 29, when morphologically distinct subregions first appear. With morphologic differentiation, differential cadherin expression begins in some of these subregions. For example, in the PT, three secondary subdivisions give rise to three distinct and separate sets of (cadherin-expressing) pretectal brain nuclei, as shown previously by other studies (Rendahl, 1924; Martínez-de-la-Torre, 1985; De Castro et al., 1998). A similar temporal and spatial coincidence between cadherin expression and morphologic differentiation also is observed in most of the DT.
In conclusion, the expression of each cadherin is linked closely to the formation of specific diencephalic brain nuclei. Numerous in vitro and in vivo studies have demonstrated that cells that express the same type of cadherin aggregate, whereas cells that express different types of cadherin tend to segregate from one another (for reviews, see Takeichi, 1995; Redies, 2000). Therefore, it seems reasonable to postulate that the preferentially homotypic adhesiveness mediated by cadherins plays an important morphogenetic role during brain nucleus formation, as proposed previously (Gänzler and Redies, 1995; Redies, 1995).
Whether early neurons are predetermined to express a particular cadherin or can be induced to change cadherin expression by their environment during the formation of brain nuclei remains to be studied. In this context, it is of interest that, in a few cases, cad6B already is expressed by early neurons during their migration. An example are the cad6B-positive early neurons of the anteroventral subdivision of the DT: These cells are characterized by cad6B expression during their migration from the ventricular surface to the pial surface (Fig. 11) in coincidence with the expression of specific transcription factors (Puelles et al., 1999; Uchikawa et al., 1999). Another example are the cad6B-positive cells in the PT: These cells are dispersed widely between stages 27 and 31 but then appear to coalesce at the surface of the PT to form the prospective external pretectal nucleus (Fig. 12; for later stages, see also De Castro et al., 1998).
With few exceptions, the diencephalic brain nuclei studied in the current work maintained their profile of cadherin expression during their further differentiation (Fig. 15). Consequently, cadherins can be used as molecular markers to follow the fate of specific brain nuclei during CNS development (see the accompanying paper; Redies et al., 2000). Most diencephalic brain nuclei remain within the division in which they originate, and the early divisional borders are replaced gradually by the borders of brain nuclei. Due to differences in proliferative and migratory behavior of cells within the embryonic divisions, the divisions and their boundaries become distorted during brain morphogenesis (Puelles et al., 1991; Puelles, 1995). It should be noted, however, that the topologic relations between the alar diencephalic divisions studied here are preserved.
CONCLUSIONS
The current results support the general idea that cadherins provide a framework of adhesive cues during brain development. Specifically, they show that cadherin expression can be used to follow the development of the early embryonic divisions of the chicken diencephalic alar plate. During development, each division of the diencephalic alar plate gradually becomes filled by developing brain nuclei. Thus, the early regionalization of the neural tube into embryonic divisions provides one of the bases for the functional architecture of the mature brain.
Acknowledgements
This work was supported by the Deutsche Forschungsgemeinschaft (grant Re 616/4-1 to C.R.), by EEC contract BIO4-CT96-0042 (to L.P.), and by the Spanish Ministerio de Relaciones Exteriores and German Academic Exchange Service (grant HA1996-0149 to C.R. and L.P.). The authors thank Drs. E. de la Rosa and U. Dräger for antibodies.


